Fig. 8
Download original image
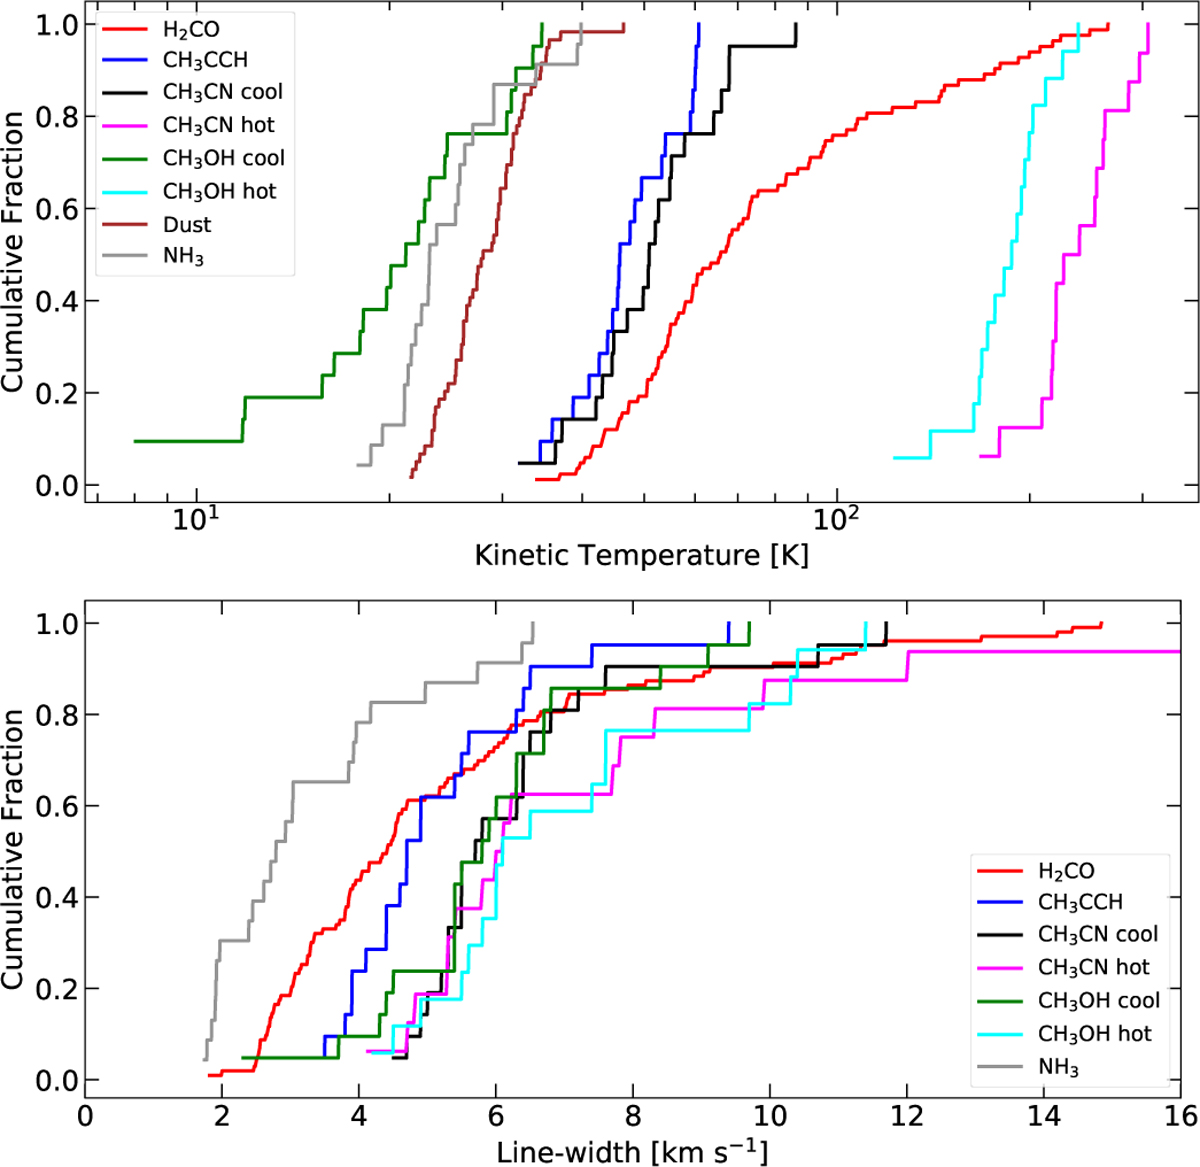
Cumulative distribution functions for temperatures (top panel) and line width (bottom panel) for different H II regions. Different colors represent various tracers and components, as indicated in the legend. The NH3 properties are from Wienen et al. (2012). The CH3CCH, CH3OH (hot and cold), and CH3CN (hot and cold) properties are from Giannetti et al. (2017), whereas dust properties are from Urquhart et al. (2018).
Current usage metrics show cumulative count of Article Views (full-text article views including HTML views, PDF and ePub downloads, according to the available data) and Abstracts Views on Vision4Press platform.
Data correspond to usage on the plateform after 2015. The current usage metrics is available 48-96 hours after online publication and is updated daily on week days.
Initial download of the metrics may take a while.