Open Access
Fig. 1.
Download original image
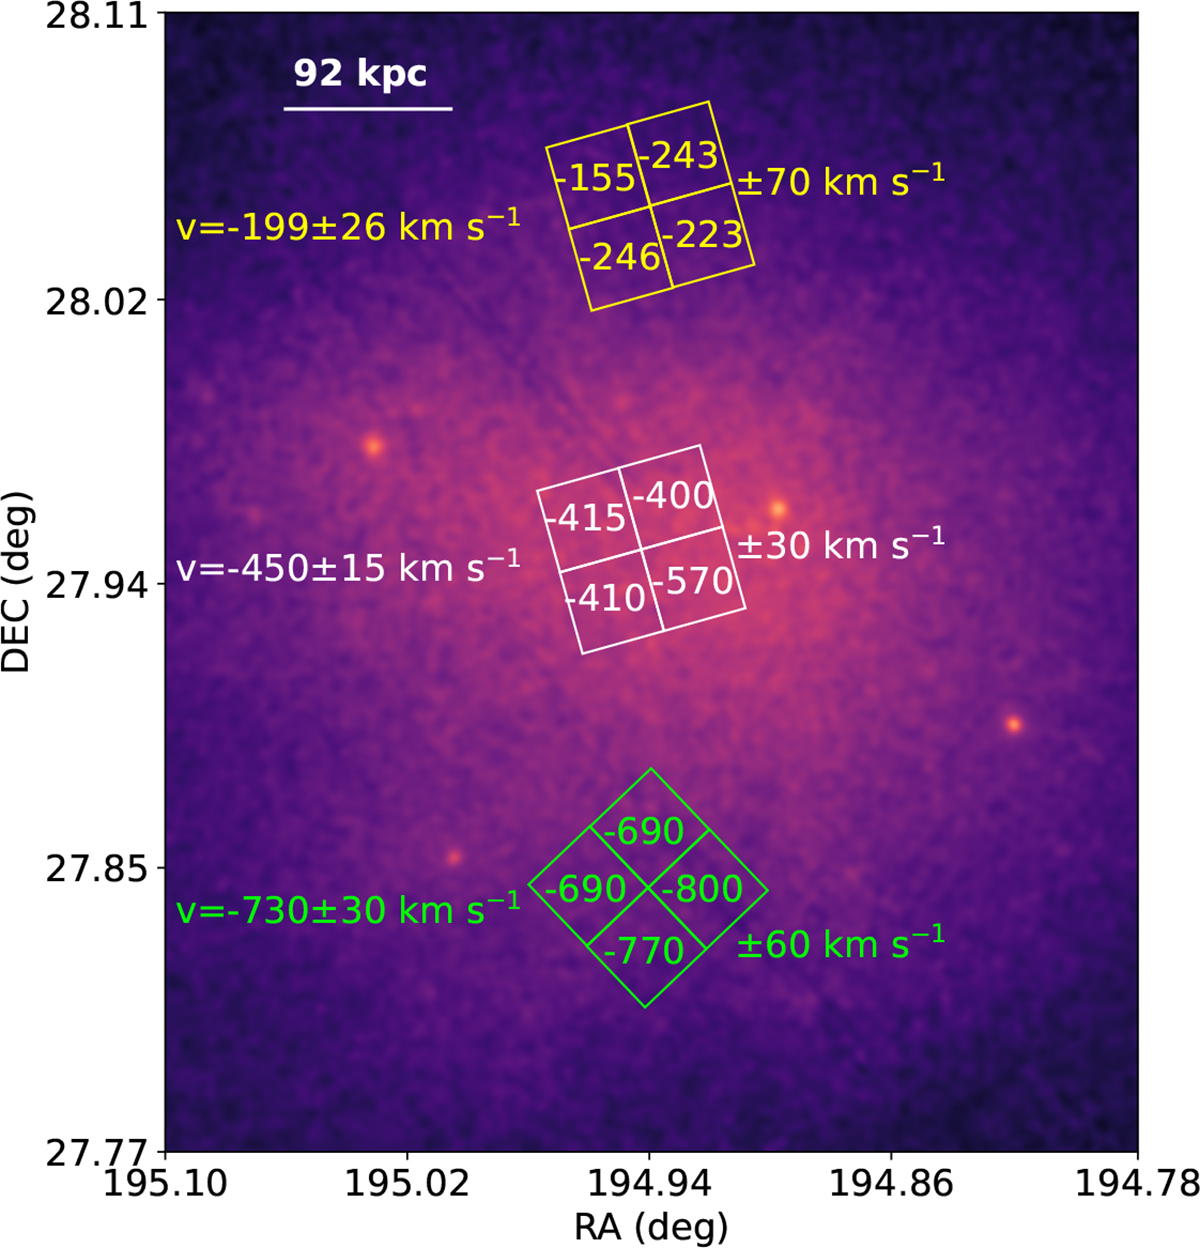
Line-of-sight bulk velocities (vbulk) for the Coma cluster: northern region (yellow) and center-south (white-green; XRISM Collaboration 2025c). Values are shown for the full FOV and quadrants, overlaid on the XMM-Newton X-ray image (Sanders et al. 2020). Quadrant points include mean uncertainties.
Current usage metrics show cumulative count of Article Views (full-text article views including HTML views, PDF and ePub downloads, according to the available data) and Abstracts Views on Vision4Press platform.
Data correspond to usage on the plateform after 2015. The current usage metrics is available 48-96 hours after online publication and is updated daily on week days.
Initial download of the metrics may take a while.