| Issue |
A&A
Volume 706, February 2026
|
|
|---|---|---|
| Article Number | L21 | |
| Number of page(s) | 5 | |
| Section | Letters to the Editor | |
| DOI | https://doi.org/10.1051/0004-6361/202558064 | |
| Published online | 18 February 2026 | |
Letter to the Editor
Coherent bulk motions in a weakly turbulent merging Coma cluster
1
Max-Planck-Institut für extraterrestrische Physik Gießenbachstraße 1 85748 Garching, Germany
2
Institute for Frontiers in Astronomy and Astrophysics, Beijing Normal University Beijing 102206, China
3
Institute of Astronomy Madingley Road Cambridge CB3 0HA, UK
4
INAF – IASF Palermo Via U. La Malfa 153 I-90146 Palermo, Italy
5
Department of Astronomy, University of Geneva Ch. d’Ecogia 16 CH-1290 Versoix, Switzerland
6
Department of Physics and Astronomy, University of Alabama in Huntsville Huntsville AL 35899, USA
★ Corresponding author: This email address is being protected from spambots. You need JavaScript enabled to view it.
Received:
11
November
2025
Accepted:
31
January
2026
Abstract
The hot gas permeating galaxy clusters – the intracluster medium (ICM) – is a key tracer of their assembly history and internal dynamics. Understanding the motion of this gas provides critical insight into processes such as mergers, turbulence, and energy dissipation in the largest gravitationally bound structures in the Universe. The Coma cluster is a nearby, massive system long suspected to be dynamically disturbed. Previous high-resolution X-ray spectroscopy with the XRISM mission revealed bulk motions in the cluster core and southern regions. Here we present new XRISM Resolve observations of a northern region in Coma, which reveal a coherent velocity gradient of nearly 530 km/s across the cluster from south to north. We find that the hot gas in this northern region exhibits modest line-of-sight motions and uniform thermodynamic properties, indicating relatively mild local disturbances. The consistent levels of turbulence throughout the cluster suggest that the energy from a past merger has been distributed on large scales. These findings provide compelling evidence for an off-axis merger event and demonstrate how high-resolution X-ray spectroscopy can uncover subtle dynamical signatures in the ICM, offering important constraints for simulations of cluster evolution.
Key words: galaxies: clusters: intracluster medium / galaxies: clusters: individual: Coma / X-rays: galaxies: clusters
© The Authors 2026
 Open Access article, published by EDP Sciences, under the terms of the Creative Commons Attribution License (https://creativecommons.org/licenses/by/4.0), which permits unrestricted use, distribution, and reproduction in any medium, provided the original work is properly cited.
This article is published in open access under the Subscribe-to-Open model.
Open access funding provided by Max Planck Society.
1. Introduction
Galaxy clusters grow through mergers and accretion, processes that drive turbulent motions and bulk flows in the intracluster medium (ICM), influencing pressure support, metal transport, and energy redistribution (Heinz et al. 2010; Schmidt et al. 2017; ZuHone et al. 2018; Vazza et al. 2021). Over the past decade, indirect constraints from X-ray and Sunyaev-Zel’dovich surface-brightness fluctuations have provided statistical insights into the amplitude and spectrum of ICM motions in nearby clusters, including Coma (Churazov et al. 2012; Zhuravleva et al. 2018). Direct velocity measurements, however, have been limited by spectral resolution, and calibration uncertainties (Zhuravleva et al. 2014; Pinto et al. 2015; Liu et al. 2018), until Hitomi resolved line-of-sight gas motions in the Perseus cluster, demonstrating that Active Galactic Nucleus (AGN) driven velocity fluctuations on ∼10–50 kpc scales are subsonic yet sufficiently energetic to balance radiative cooling in the ICM (Hitomi Collaboration 2016).
The launch of XRISM in 2023 has enabled high-resolution spectroscopy across cluster-wide scales. Observations of Abell 2029 show a nearly low-turbulence ICM with subsonic velocity dispersions (169 ± 10 km/s) and a nonthermal pressure fraction of ∼2.6%, while Centaurus exhibits modest bulk flows (130 − 310 km/s) with similarly highly subsonic velocities XRISM Collaboration (2025a,b). The Coma cluster (z = 0.02333, Bilton & Pimbblet 2018), a massive nearby cluster undergoing complex mergers, presents a unique environment for studying large-scale gas motions. It exhibits multiple signatures of ongoing dynamical activity: a disturbed X-ray morphology, a giant radio halo, and substructures associated with the dominant galaxies NGC 4874 and NGC 4889, which exhibit a velocity offset of ∼700 km/s (Fitchett & Webster 1987; Briel et al. 1992; White et al. 1993; Adami et al. 2005). Infalling groups such as NGC 4839 and NGC 4911/4921 further complicate the cluster’s velocity field Adami et al. (2005). Recent XRISM observations of the core and southern regions revealed substantial bulk motions alongside subsonic velocity dispersions, indicating subsonic turbulence and a dynamically evolved state XRISM Collaboration (2025c). Here we present new XRISM Resolve observations of a northern region, extending coverage beyond performance verification pointings.
2. XRISM data reduction
The northern Coma cluster was observed with XRISM/Resolve on 2025 January 14 (ObsID 201114010) for a net exposure of 144.8 ks after standard filtering. The energy resolution was 4.51 ± 0.02 eV at 5.9 keV, corresponding to a velocity uncertainty < 10 km/s, well below the statistical errors.
Spectra were extracted for the full field of view (FOV) and for four quadrants (NE, NW, SE, and SW) to probe spatial variations. The non-X-ray background (NXB) contributed < 8% of the counts, and Auxiliary Response Files (ARFs) were computed using Chandra 2–7 keV images with point sources removed. Point Spread Function (PSF) scattering effects were modeled with xrtraytrace. For further details on the data reduction, including event selection, response generation, and quadrant extraction, see Appendix A.
3. Spectral fitting
Spectral fitting was performed in the 2–10 keV band using xspec v12.14.1 and Cash statistics (Cash 1979). The ICM was modeled with a single-temperature bapec component including thermal and turbulent broadening. Redshift, temperature, abundance (proto-solar, Lodders et al. 2009), velocity dispersion, and normalization were free parameters. Galactic absorption was included via tbabs with NH = 8.66 × 1020 cm−2 (Willingale et al. 2013), and all velocities were corrected to the heliocentric frame. To test for multi-temperature structures, two-temperature (bapec+bapec) and lognormal (blognorm, Gatuzz et al. 2022) models were also applied. The NXB contributed < 8% of counts and had negligible effect on velocity measurements. For full technical details, including model configurations, parameter tying, and Markov Chain Monte Carlo (MCMC) sampling, see Appendix B.
4. Results and discussion
We performed spectral fitting over the full XRISM Resolve FOV using three ICM models: a single-temperature bapec, a two-temperature bapec+bapec, and a lognormal temperature distribution with blognorm. To test whether complex models were statistically warranted, we used a simulation-based Δcstat method following Buchner & Boorman (2023). For each case, 1000 spectra were simulated from the simpler model, and the 99th percentile of the resulting Δcstat distribution defined the critical threshold (Δcstatcrit) corresponding to a 1% false-positive rate. We found Δcstatcrit = 6.38 for 2-bapec and 3.75 for blognorm. Neither model exceeded these thresholds, confirming that a single-temperature component adequately describes the data. The blognorm model only yielded an upper limit on the width parameter, and the second component in the two-temperature fit was consistent with zero. This supports a uniform thermal structure, consistent with previous findings in the Coma outskirts (Arnaud et al. 2001; Sanders et al. 2020; XRISM Collaboration 2025c).
Best-fit parameters for the bapec model obtained via MCMC are listed in Extended Data Table 1. Convergence diagnostics confirmed robust mixing (τ ≲ 1), yielding ≳3.8 × 10⁷ effective samples. The best-fit redshift corresponds to a bulk velocity of vbulk = −199 ± 26 km/s and a velocity dispersion of σv = 167 ± 39 km/s. These values agree with XMM-Newton results (z = 0.023, v = −57 ± 150 km/s; Sanders et al. 2020) and are notably lower than those observed in the Coma core (−450 ± 15 km/s) and southern regions (−730 ± 30 km/s; Fig. 1), confirming significant large-scale gas motions across the cluster.
Best-fit parameters in the 2–10 keV energy band for all regions analyzed.
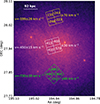 |
Fig. 1. Line-of-sight bulk velocities (vbulk) for the Coma cluster: northern region (yellow) and center-south (white-green; XRISM Collaboration 2025c). Values are shown for the full FOV and quadrants, overlaid on the XMM-Newton X-ray image (Sanders et al. 2020). Quadrant points include mean uncertainties. |
To examine spatial variations in the thermodynamic and kinematic properties of the ICM, the XRISM Resolve FOV was divided into four quadrants: northeast (NE), northwest (NW), southeast (SE), and southwest (SW). Each region contains ∼200 counts in the Fe XXV–XXVI complex (6.4–6.9 keV), sufficient to constrain line centroids and measure velocity dispersions, albeit with large statistical uncertainties due to limited counts. Spectra were fit independently using a single-temperature bapec model following XRISM Collaboration (2025c), with parameter uncertainties explored through MCMC sampling. The best-fit results are listed in Table 1, and Fig. 2 shows the corresponding bulk and turbulent velocities. Bulk velocities range from vbulk = −246 to −155 km/s, with 1σ uncertainties of ≲100 km/s. Measured velocity dispersions span σv = 118–444 km/s, reflecting the limited photon statistics rather than intrinsic variability. Temperatures are consistent within kT = 7.60–8.55 keV, and Fe abundances lie between Z = 0.25–0.38 (proto-solar). Overall, no significant spatial gradients are detected, indicating that the ICM in this region is thermally and kinematically uniform within current uncertainties.
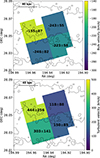 |
Fig. 2. Velocity maps obtained for the Coma cluster. Top panel: Bulk velocities (vbulk) obtained from the XRISM Resolve spectra. Bottom panel: Turbulent velocities (σv). The Chandra contours for the broadband energy range (0.5–7 keV) are included. |
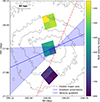 |
Fig. 3. Spatial distribution of Coma ICM line-of-sight velocities. XRISM Resolve pointings (north, center, and south) are divided into quadrants (NE, NW, SE, and SW) and color-coded by vbulk. Smoothed X-ray contours show gas density; the blue line indicates the best-fit velocity gradient (shaded region = uncertainty); and the dashed red line marks the cluster major axis (PA = 65°). The plot highlights a coherent large-scale velocity shear slightly misaligned with the cluster elongation. |
We tested the spatial uniformity of velocity, velocity dispersion, temperature, and metallicity across the four quadrants by comparing each parameter to a constant model defined by the inverse-variance weighted mean. Reduced χ2 and p-value analyses, along with the largest deviations from the mean, showed no significant departures from uniformity: 0.52σ for vbulk, 0.90σ for σv, 0.56σ for kT, and 0.78σ for Z. These results indicate consistency across the field, though moderate intrinsic variations may remain undetected within current uncertainties. To further quantify possible small-scale inhomogeneities, we applied an MCMC analysis modeling the total variance as  . The ICM bulk velocity is consistent across all regions, with a common mean of vbulk = −226 ± 33 km/s and negligible intrinsic scatter (σI < 0.01). The velocity dispersion, temperature, and metallicity show mild variations, with σv = 174 ± 55 km/s, kT = 8.03 ± 0.35 keV, and Z = 0.28 ± 0.03 Z⊙, all with σI < 10. Overall, the ICM appears homogeneous on the Resolve scale, with only subtle, percent-level fluctuations consistent with the data.
To characterize the ICM velocity structure, we used the mean line-of-sight velocities from the three XRISM Resolve pointings (north, center, and south). Projected positions relative to the cluster center (RA0 = 12h59m46s, Dec0 = +27° 56′00″) were converted to kiloparsec, and the velocity field was modeled as a linear plane:
 (1)
(1)
with v0 the central velocity and (a, b) the gradients along Right ascension (RA) and Declination (Dec). The fit yields a = 0.016 km/s/kpc and b = 4.06 km/s/kpc, giving a total gradient |∇v| = 4.06 km/s/kpc oriented θ = 22.3 ± 20.6° east of RA, or −42.7° relative to the cluster major axis. This indicates a coherent, large-scale velocity shear across the ICM, providing the first high-resolution spectroscopic measurement of bulk motions in Coma over multiple scales, extending earlier XMM-Newton results (Sanders et al. 2020). While the orientation is indicative given limited sampling, this direct gradient measurement offers a complementary view of ICM dynamics pending the full velocity structure function analysis in a forthcoming study.
To assess the local dynamical state of the ICM, we compared XRISM Resolve line-of-sight velocities with the redshifts of seven cluster member galaxies within the northern FOV (Michard & Andreon 2008; den Brok et al. 2011; Eisenhardt et al. 2007). The galaxy sample has a mean redshift ⟨zgal⟩ = 0.0250 (⟨vgal⟩ = 7508 km/s) and standard deviation σz, gal = 0.0034 (σv, gal = 1021 km/s). A simple z-test shows the XRISM full-FOV velocity differs by only 0.68σ from the galaxy mean, indicating no strong deviation within this small sample. To account for the large intrinsic galaxy scatter, we performed a Bayesian MCMC analysis modeling the ICM and galaxy mean velocities and the intrinsic galaxy dispersion. This yields a median velocity offset of  km/s, with the 68% credible interval excluding zero, indicating a statistically significant bulk motion of the ICM relative to the local galaxy population. These results suggest the ICM in the northern FOV is either part of a distinct kinematic substructure or exhibits coherent bulk flows, reflecting a dynamically active state.
We estimated the contribution of turbulent motions to the ICM pressure by computing the adiabatic sound speed cs, the 3D Mach number  , the turbulent-to-thermal energy ratio
  , and the kinetic pressure fraction
  . Here, σv is the line-of-sight velocity dispersion, which quantifies random gas motions that contribute to pressure support, while coherent bulk velocities are excluded. We adopted γ = 5/3, μ = 0.61 and the best-fit ICM temperature from the spectral analysis. Uncertainties were propagated assuming Gaussian errors on σv and kT.
For the northern Coma FOV, we find ℳ3D = 0.197 ± 0.046, Eturb/Etherm = 0.032 ± 0.015, and Pturb/Ptot = 0.021 ± 0.010, indicating subsonic turbulence with only ∼2% nonthermal pressure support. These results are in excellent agreement with recent XRISM measurements: A2029 (M3D = 0.22, Pkin/Ptot = 2.6%), Centaurus (M3D ≲ 0.2, Eturb/Etherm ∼ 3%), Perseus (M3D ∼ 0.1 − 0.3, Pkin/Ptot ∼ 1 − 5%), Coma Performance Verification (PV) pointings (M3D = 0.24 ± 0.015, Pkin/Ptot = 3.1 ± 0.4%), Ophiuchus (M3D = 0.16, Pkin/Ptot = 1.4%), and Abell 2319 ( ,
,  ). Our Mach numbers and nonthermal pressure fractions are also broadly consistent with indirect measurements based on X-ray and Sunyaev-Zeldovich (SZ) surface-brightness fluctuations, including Churazov et al. (2012) for Coma (M3D ∼ 0.23, Eturb/Etherm ∼ 3%), Zhuravleva et al. (2018) (Eturb/Etherm ∼ 5%), Dupourqué et al. (2024) (M3D ∼ 0.4, Pturb/Ptot ∼ 9%), and Romero et al. (2025) (M3D ∼ 0.52). Following the emission-measure–weighted definition adopted in XRISM collaboration papers (e.g., XRISM Collaboration 2025d), and consistent with the approach of Zhuravleva et al. (2012), we estimate the effective line-of-sight depth contributing to the X-ray emission in the northern Coma FOV to be ∼260 kpc. This value is in good agreement with the XRISM southern Coma pointing (XRISM Collaboration 2025c) and is significantly higher than in more centrally peaked systems such as Centaurus (≲50 kpc, XRISM Collaboration 2025c) or M87 (∼5–35 kpc, XRISM Collaboration 2025d). While differences in line-of-sight depth can affect the inferred velocity dispersion, the Coma ICM shows coherent large-scale bulk motions with locally subsonic turbulence and modest nonthermal pressure support.
5. The complex ICM dynamics of the Coma cluster
In addition to subsonic turbulence, we detect coherent bulk motions in Coma. Combining our northern pointing with previous XRISM measurements of the central and southern regions (XRISM Collaboration 2025c) reveals line-of-sight velocities of −730 km/s (south), −450 km/s (core), and −199 km/s (north), corresponding to a ∼530 km/s gradient across several hundred kiloparsecs (Figure 1). Fitting a planar velocity model yields a gradient of ∼4.1 km/s/kpc, oriented 22 ± 21° east of the RA axis, slightly misaligned with the cluster elongation, indicating a coherent velocity shear. Subdividing each field into quadrants produces similar trends, though uncertainties limit sensitivity to small-scale variations.
Compared with other nearby clusters observed with XRISM, Coma displays distinctive kinematics. Its northern line-of-sight velocity dispersion (σv = 167 ± 39 km/s) is comparable to relaxed systems such as the A2029 core (XRISM Collaboration 2025a), yet unlike those clusters, Coma exhibits a global velocity gradient spanning hundreds of kiloparsecs. Despite this, the Mach number and nonthermal pressure fraction remain low, consistent with a locally relaxed ICM. These features are naturally explained by an off-axis merger, producing large-scale bulk flows while maintaining near-uniform thermodynamic and kinematic properties within each pointing. Hydrodynamical simulations and recent theoretical studies (Biffi et al. 2011, 2022; Vazza & Brunetti 2026; Groth et al. 2025) support this scenario, showing that mergers can generate extended velocity gradients without strongly enhancing local turbulence. Together, these findings reinforce our observational conclusion that the Coma ICM exhibits coherent bulk motions over hundreds of kiloparsecs while maintaining relatively subsonic velocities and near-uniform properties within individual XRISM pointings.
6. Conclusions and summary
We analyzed the velocity structure of the Coma galaxy cluster using new XRISM/Resolve observations of a region north of the cluster core. The spectrum of the ICM is well described by a single-temperature model, with no significant improvement obtained from more complex descriptions. For the entire FOV, we measure a line-of-sight bulk velocity of vbulk = ( − 199 ± 26) km/s and a velocity dispersion of σv = (167 ± 39) km/s. Dividing the field into four quadrants reveals uniform thermodynamic properties and subsonic velocity dispersions, confirming the absence of strong local disturbances. The ICM redshift is consistent with that of the cluster member galaxies detected in the same region, suggesting that the hot gas and galaxies share a common dynamical state. From these measurements, we derive a 3D Mach number of ℳ3D = 0.197 ± 0.046, corresponding to a turbulent-to-thermal energy ratio of (3.2 ± 1.5)% and a kinetic pressure fraction of (2.1 ± 0.5)% of the total ICM pressure.
When combined with previous XRISM observations of the Coma core and southern regions, our measurements reveal a coherent velocity gradient of ∼4.06 km/s/kpc (∼530 km/s) across the cluster from south to north), oriented 22.3° ±20.6° east of the right ascension axis. This large-scale shear, together with the uniform velocity dispersion across the pointings, provides direct evidence for an off-axis merger event that generated coherent bulk flows while leaving the local ICM relatively relaxed. The derived subsonic motions and modest nonthermal pressure support indicate that Coma is currently in a late-stage post-merger phase characterized by ordered large-scale flows. Overall, these results establish Coma as a benchmark for studies of cluster dynamics and demonstrate the capability of high-resolution X-ray spectroscopy to map multi-scale gas motions in the ICM.
References
- Adami, C., Biviano, A., Durret, F., & Mazure, A. 2005, A&A, 443, 17 [NASA ADS] [CrossRef] [EDP Sciences] [Google Scholar]
- Arnaud, M., Aghanim, N., Gastaud, R., et al. 2001, A&A, 365, L67 [NASA ADS] [CrossRef] [EDP Sciences] [Google Scholar]
- Biffi, V., Dolag, K., & Böhringer, H. 2011, MNRAS, 413, 573 [NASA ADS] [CrossRef] [Google Scholar]
- Biffi, V., ZuHone, J. A., Mroczkowski, T., Bulbul, E., & Forman, W. 2022, A&A, 663, A76 [NASA ADS] [CrossRef] [EDP Sciences] [Google Scholar]
- Bilton, L. E., & Pimbblet, K. A. 2018, MNRAS, 481, 1507 [CrossRef] [Google Scholar]
- Briel, U. G., Henry, J. P., & Boehringer, H. 1992, A&A, 259, L31 [NASA ADS] [Google Scholar]
- Buchner, J., & Boorman, P. 2023, in Handbook of X-ray and Gamma-ray Astrophysics, 150 [Google Scholar]
- Cash, W. 1979, ApJ, 228, 939 [Google Scholar]
- Churazov, E., Vikhlinin, A., Zhuravleva, I., et al. 2012, MNRAS, 421, 1123 [NASA ADS] [CrossRef] [Google Scholar]
- den Brok, M., Peletier, R. F., Valentijn, E. A., et al. 2011, MNRAS, 414, 3052 [Google Scholar]
- Dupourqué, S., Clerc, N., Pointecouteau, E., et al. 2024, A&A, 687, A58 [NASA ADS] [CrossRef] [EDP Sciences] [Google Scholar]
- Eisenhardt, P. R., De Propris, R., Gonzalez, A. H., et al. 2007, ApJS, 169, 225 [NASA ADS] [CrossRef] [Google Scholar]
- Fitchett, M., & Webster, R. 1987, ApJ, 317, 653 [Google Scholar]
- Foster, A., Smith, R., & Brickhouse, N. S. 2019, Am. Astron. Soc. Meeting Abstr., 233, 251.05 [Google Scholar]
- Gatuzz, E., Sanders, J. S., Canning, R., et al. 2022, MNRAS, 513, 1932 [NASA ADS] [CrossRef] [Google Scholar]
- Groth, F., Valentini, M., Seidel, B. A., et al. 2025, ArXiv e-prints [arXiv:2507.02041] [Google Scholar]
- Heinz, S., Brüggen, M., & Morsony, B. 2010, ApJ, 708, 462 [Google Scholar]
- Hitomi Collaboration (Aharonian, F., et al.) 2016, Nature, 535, 117 [Google Scholar]
- Hitomi Collaboration (Aharonian, F., et al.) 2018, PASJ, 70, 12 [NASA ADS] [Google Scholar]
- Kaastra, J. S., & Bleeker, J. A. M. 2016, A&A, 587, A151 [NASA ADS] [CrossRef] [EDP Sciences] [Google Scholar]
- Liu, A., Yu, H., Diaferio, A., et al. 2018, ApJ, 863, 102 [NASA ADS] [CrossRef] [Google Scholar]
- Lodders, K., Palme, H., & Gail, H.-P. 2009, Landolt Börnstein, 4B, 712 [Google Scholar]
- Michard, R., & Andreon, S. 2008, A&A, 490, 923 [NASA ADS] [CrossRef] [EDP Sciences] [Google Scholar]
- Pinto, C., Sanders, J. S., Werner, N., et al. 2015, A&A, 575, A38 [NASA ADS] [CrossRef] [EDP Sciences] [Google Scholar]
- Romero, C. E., Gaspari, M., Schellenberger, G., et al. 2025, ApJ, 985, 248 [Google Scholar]
- Sanders, J. S., Dennerl, K., Russell, H. R., et al. 2020, A&A, 633, A42 [EDP Sciences] [Google Scholar]
- Schmidt, W., Byrohl, C., Engels, J. F., Behrens, C., & Niemeyer, J. C. 2017, MNRAS, 470, 142 [NASA ADS] [CrossRef] [Google Scholar]
- Vazza, F., & Brunetti, G. 2026, A&A, 705, A129 [NASA ADS] [CrossRef] [EDP Sciences] [Google Scholar]
- Vazza, F., Wittor, D., Brunetti, G., & Brüggen, M. 2021, A&A, 653, A23 [NASA ADS] [CrossRef] [EDP Sciences] [Google Scholar]
- White, S. D. M., Briel, U. G., & Henry, J. P. 1993, MNRAS, 261, L8 [Google Scholar]
- Willingale, R., Starling, R. L. C., Beardmore, A. P., Tanvir, N. R., & O’Brien, P. T. 2013, MNRAS, 431, 394 [Google Scholar]
- XRISM Collaboration (Audard, M., et al.) 2025a, PASJ, 77, S242 [Google Scholar]
- XRISM Collaboration (Audard, M., et al.) 2025b, Nature, 638, 365 [Google Scholar]
- XRISM Collaboration (Audard, M., et al.) 2025c, ApJ, 985, L20 [Google Scholar]
- XRISM Collaboration (Audard, M., et al.) 2025d, ArXiv e-prints [arXiv:2512.06596] [Google Scholar]
- Zhuravleva, I., Churazov, E., Kravtsov, A., & Sunyaev, R. 2012, MNRAS, 422, 2712 [NASA ADS] [CrossRef] [Google Scholar]
- Zhuravleva, I., Churazov, E., Schekochihin, A. A., et al. 2014, Nature, 515, 85 [Google Scholar]
- Zhuravleva, I., Allen, S. W., Mantz, A., & Werner, N. 2018, ApJ, 865, 53 [CrossRef] [Google Scholar]
- ZuHone, J. A., Miller, E. D., Bulbul, E., & Zhuravleva, I. 2018, ApJ, 853, 180 [NASA ADS] [CrossRef] [Google Scholar]
Appendix A: Detailed data reduction
The XRISM/Resolve observation of the Coma northern offset region (ObsID 201114010) was performed on 2025 January 14. Data reduction followed standard XRISM procedures (XRISM Collaboration 2025a,b,c) using HEASoft v6.34 and XRISM CalDB release 20241115. Events during South Atlantic Anomaly passages, Earth occultation, and low elevation (< 20°) from the sunlit limb were excluded, yielding a net exposure of 144.8 ks.
The onboard 55Fe calibration source provided an energy resolution of 4.51 ± 0.02 eV at 5.9 keV and an energy-scale offset < 0.1 eV, corresponding to a velocity uncertainty < 10 km/s. Spectra were extracted using high-resolution primary events (ITYPE = 0), excluding pixel 27 due to gain instability. The 2–10 keV count rate was 0.0697 ± 0.0007 cts/s, totaling ∼10100 counts, and spectra were optimally binned to one count per channel (Kaastra & Bleeker 2016).
Non-X-ray background spectra were generated using rslnxbgen from the Night Earth database, contributing < 8% of the total counts. Response files were generated with rslmkrmf and xaarfgen, adopting the “split-matrix” configuration for electron-loss continuum. ARFs were computed from a 2–7 keV Chandra ACIS-I image (six observations, 960 ks total) with point sources removed via wavdetect.
To investigate spatial variations, spectra and ARFs were extracted for four quadrants (NE, NW, SE, SW), each containing sufficient counts in the Fe K complex for velocity measurements. PSF scattering between quadrants was modeled with xrtraytrace, confirming negligible contamination between regions (less than 10%). This detailed data reduction ensures robust measurements of bulk velocities and turbulent line broadening across the northern Coma field.
Appendix B: Detailed spectral fitting
Spectral fitting was carried out in the 2–10 keV band using xspec v12.14.1 and Cash statistics (Cash 1979). We modeled the ICM with three approaches:
-
Single-temperature (bapec v3.0.9, Foster et al. 2019), including thermal and turbulent broadening calibrated from Hitomi Perseus results (Hitomi Collaboration 2018). Free parameters were temperature, redshift, abundance (proto-solar, Lodders et al. 2009), velocity dispersion σv, and normalization.
-
Two-temperature (bapec+bapec), with redshift, abundance, and σv tied between components.
-
Continuous temperature distribution (blognorm, Gatuzz et al. 2022), assuming a lognormal temperature distribution with free median temperature, width, and σv.
All models included Galactic absorption via tbabs with fixed NH = 8.66 × 1020 cm−2 (Willingale et al. 2013). NXB was modeled using the standard XRISM template comprising a power-law continuum and Gaussian fluorescence lines (Cr, Mn, Fe, Ni, Cu, Au), contributing < 8% of counts and having negligible impact on velocity or line-width measurements (XRISM Collaboration 2025a,b,c).
We explored parameter uncertainties with MCMC sampling using the Goodman-Weare algorithm (xspec), with 25 walkers and 2 × 10⁶ steps (first 5 × 10⁵ discarded), ensuring robust estimates of bulk velocities and turbulent line widths. Velocities were corrected to the heliocentric frame (+24.1 km/s). We adopt a flat ΛCDM cosmology with Ωm = 0.3, ΩΛ = 0.7, and H0 = 70 km/s/Mpc. All reported errors correspond to 1σ unless otherwise stated.
Figure B.1 shows the Fe K-shell features with best-fit models and residuals. Minor deviations in the Fe XXVI Lyα2 and Fe XXV intercombination lines-also seen in A2029 and Centaurus (XRISM Collaboration 2025a,c)–likely arise from residual calibration or atomic data systematics, which are being investigated through a broader cross-comparison effort.
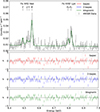 |
Fig. B.1. XRISM Resolve spectrum zoomed-in on the strongest Fe K-shell lines. He-like triplet components are shown: resonance (w), intercombination (x, y), and forbidden (z); Fe XXVI Lyα has α1 and α2 transitions. The spectrum is rebinned for clarity. Lower panels: Fit residuals for bapec (red), 2-bapec (blue), and blognorm (green). Minor deviations in Fe XXVI α2 and Fe XXV intercombination lines resemble those seen in Coma (southern and center pointings), A2029, and Centaurus (XRISM Collaboration 2025a,b,c). |
All Tables
All Figures
|
Fig. 1. Line-of-sight bulk velocities (vbulk) for the Coma cluster: northern region (yellow) and center-south (white-green; XRISM Collaboration 2025c). Values are shown for the full FOV and quadrants, overlaid on the XMM-Newton X-ray image (Sanders et al. 2020). Quadrant points include mean uncertainties. |
| In the text | |
|
Fig. 2. Velocity maps obtained for the Coma cluster. Top panel: Bulk velocities (vbulk) obtained from the XRISM Resolve spectra. Bottom panel: Turbulent velocities (σv). The Chandra contours for the broadband energy range (0.5–7 keV) are included. |
| In the text | |
|
Fig. 3. Spatial distribution of Coma ICM line-of-sight velocities. XRISM Resolve pointings (north, center, and south) are divided into quadrants (NE, NW, SE, and SW) and color-coded by vbulk. Smoothed X-ray contours show gas density; the blue line indicates the best-fit velocity gradient (shaded region = uncertainty); and the dashed red line marks the cluster major axis (PA = 65°). The plot highlights a coherent large-scale velocity shear slightly misaligned with the cluster elongation. |
| In the text | |
|
Fig. B.1. XRISM Resolve spectrum zoomed-in on the strongest Fe K-shell lines. He-like triplet components are shown: resonance (w), intercombination (x, y), and forbidden (z); Fe XXVI Lyα has α1 and α2 transitions. The spectrum is rebinned for clarity. Lower panels: Fit residuals for bapec (red), 2-bapec (blue), and blognorm (green). Minor deviations in Fe XXVI α2 and Fe XXV intercombination lines resemble those seen in Coma (southern and center pointings), A2029, and Centaurus (XRISM Collaboration 2025a,b,c). |
| In the text | |
Current usage metrics show cumulative count of Article Views (full-text article views including HTML views, PDF and ePub downloads, according to the available data) and Abstracts Views on Vision4Press platform.
Data correspond to usage on the plateform after 2015. The current usage metrics is available 48-96 hours after online publication and is updated daily on week days.
Initial download of the metrics may take a while.