Fig. 3.
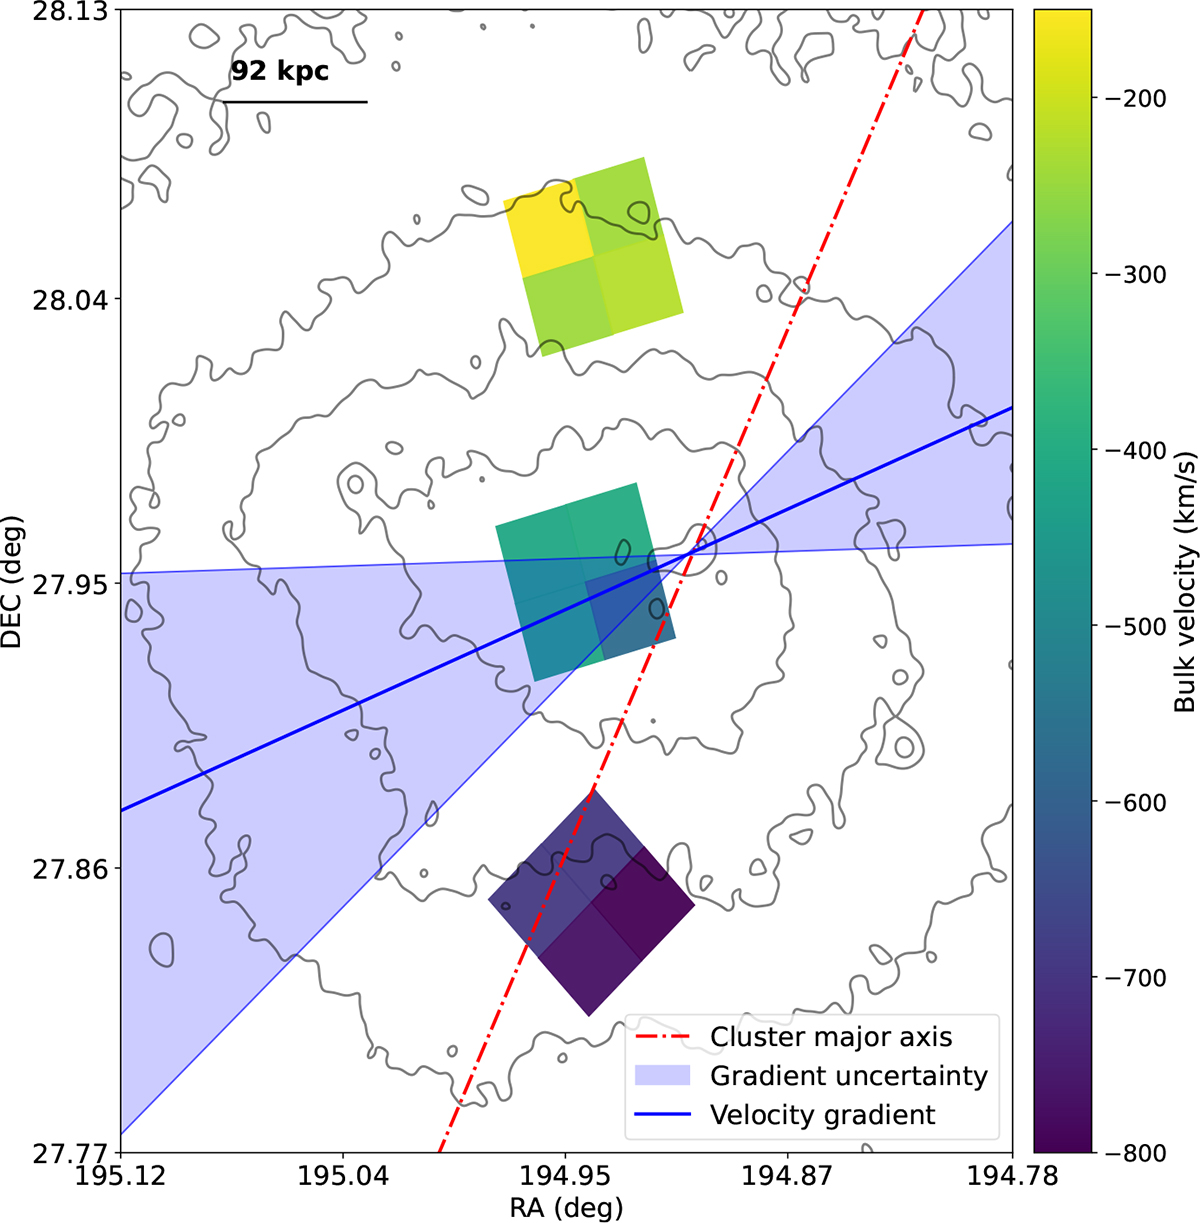
Download original image
Spatial distribution of Coma ICM line-of-sight velocities. XRISM Resolve pointings (north, center, and south) are divided into quadrants (NE, NW, SE, and SW) and color-coded by vbulk. Smoothed X-ray contours show gas density; the blue line indicates the best-fit velocity gradient (shaded region = uncertainty); and the dashed red line marks the cluster major axis (PA = 65°). The plot highlights a coherent large-scale velocity shear slightly misaligned with the cluster elongation.
Current usage metrics show cumulative count of Article Views (full-text article views including HTML views, PDF and ePub downloads, according to the available data) and Abstracts Views on Vision4Press platform.
Data correspond to usage on the plateform after 2015. The current usage metrics is available 48-96 hours after online publication and is updated daily on week days.
Initial download of the metrics may take a while.