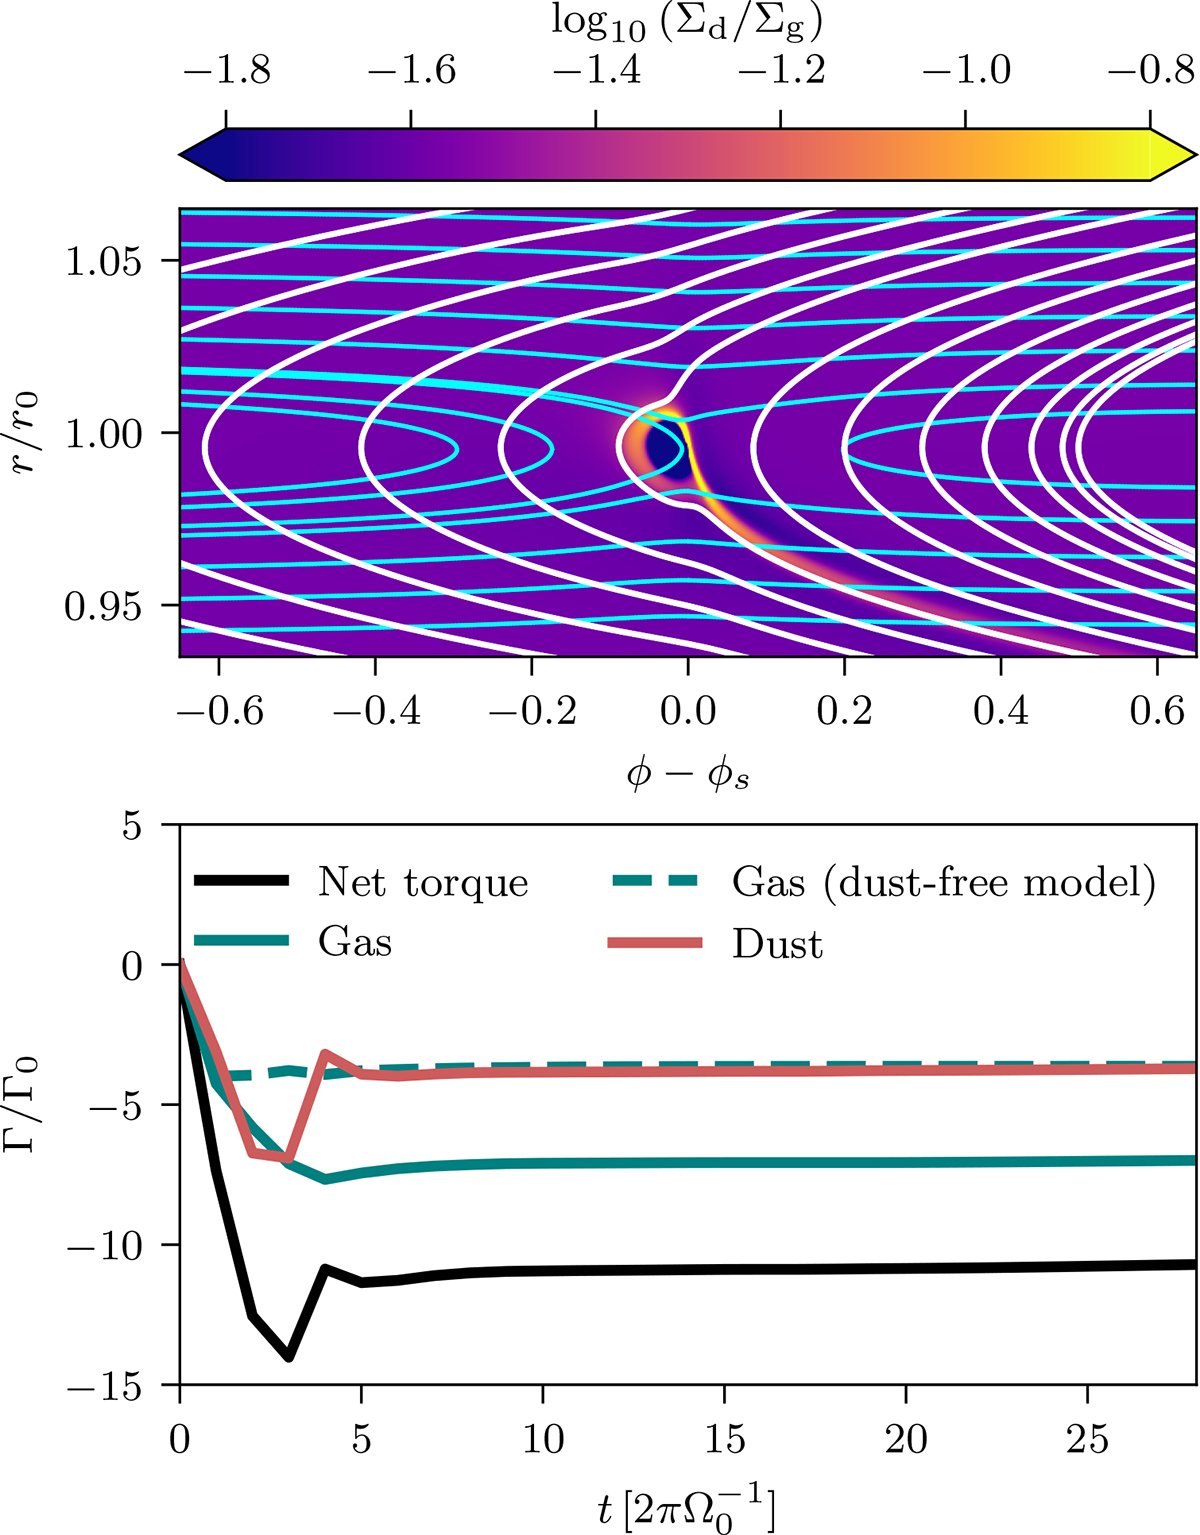
Fig. B.1.
Download original image
Top row: Dust surface density (color) with superimposed gas (cyan) and dust (white) velocity streamlines. Bottom row: Time evolution of the normalized torques exerted on the embedded moon. The solid black curve shows the net (gas + dust) torque, while the red and green curves correspond to the dust and gas contributions, respectively. The dashed green curve indicates the net gas torque in the corresponding dust-free reference simulation. Simulation corresponds to protomoon with ϵ = 0.025 and Ts = 0.35.
Current usage metrics show cumulative count of Article Views (full-text article views including HTML views, PDF and ePub downloads, according to the available data) and Abstracts Views on Vision4Press platform.
Data correspond to usage on the plateform after 2015. The current usage metrics is available 48-96 hours after online publication and is updated daily on week days.
Initial download of the metrics may take a while.