Fig. 1.
Download original image
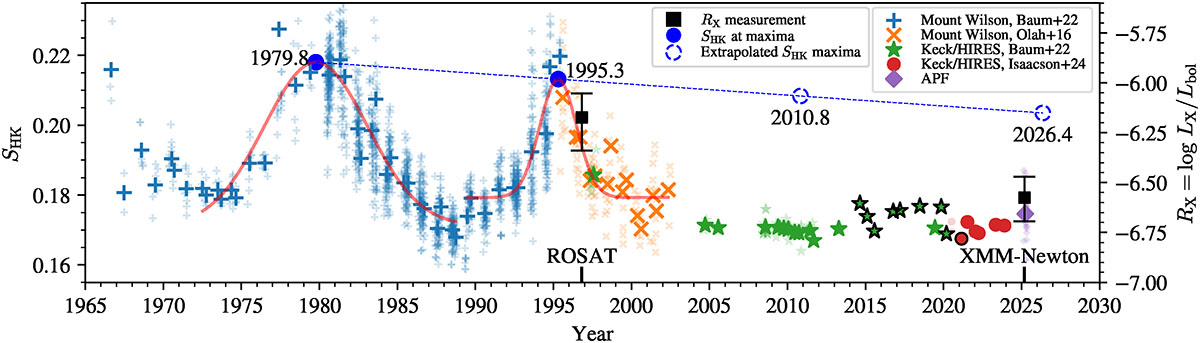
SHK and RX time series for HD 166620 with data compiled by Luhn et al. (2022) and more recent data from Keck/HIRES (Isaacson et al. 2024) and the APF (Vogt et al. 2014). The small transparent symbols mark individual SHK measurements, and the larger opaque symbols are the same data, binned in 120 d bins. A black outline denotes a bin containing only a single measurement. The dashed blue line shows the extrapolated trend of the two maxima (see Sect. 2.1). The two X-ray measurements are overplotted with black squares, and their epochs are marked on the axis.
Current usage metrics show cumulative count of Article Views (full-text article views including HTML views, PDF and ePub downloads, according to the available data) and Abstracts Views on Vision4Press platform.
Data correspond to usage on the plateform after 2015. The current usage metrics is available 48-96 hours after online publication and is updated daily on week days.
Initial download of the metrics may take a while.