Fig. 1.
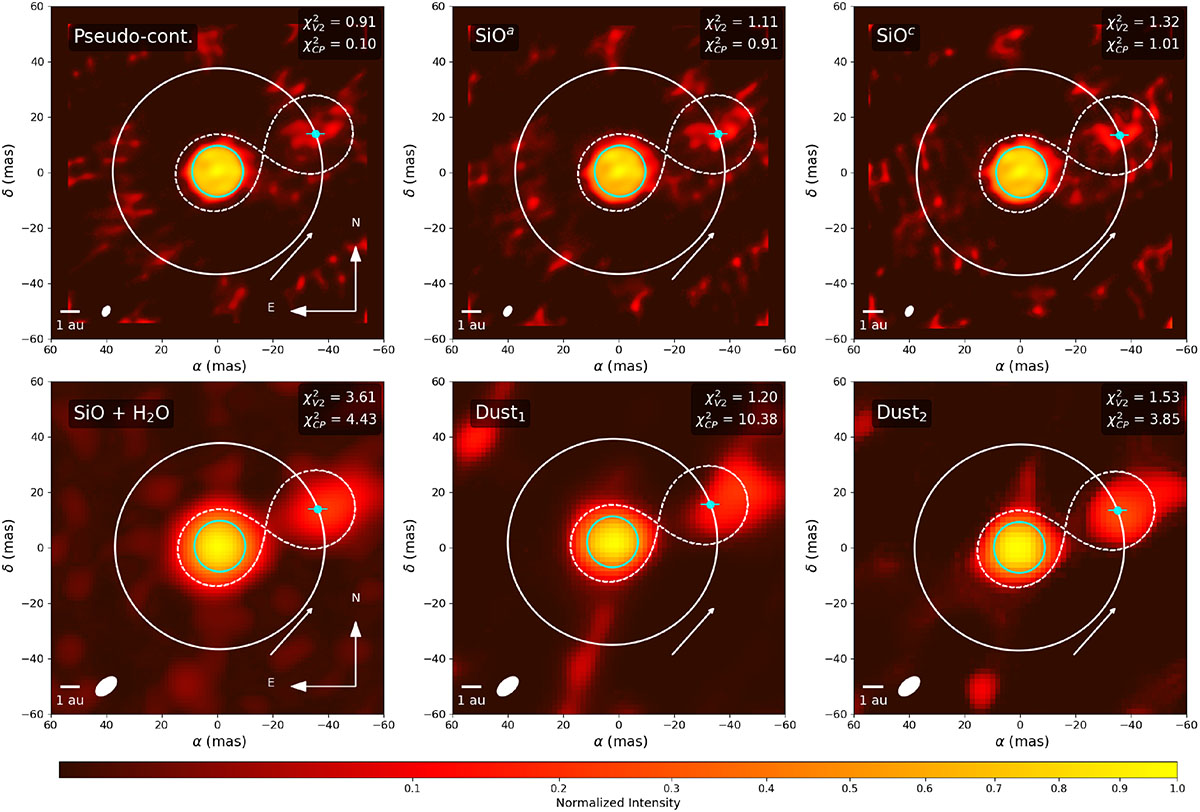
Download original image
Square-root intensity maps of the reconstructed images of π1 Gru. From left to right and top to bottom, the panels show the pseudo-continuum (4.033 μm), the SiO absorption bands SiOa (4.043 μm) and SiOc (4.084 μm), the combined SiO+H2O feature (8.4 μm), and the dust-emission features Dust1 (9.8 μm) and Dust2 (11.0 μm). The blue circle marks the H-band photospheric angular diameter of π1 Gru A (Paladini et al. 2017) and serves as a reference angular diameter for comparison with the larger sizes observed in the L and N bands. The white curve traces the orbit of the close companion π1 Gru C (Esseldeurs et al. 2025), with the blue dot and associated bars indicating its expected position and uncertainties at the MATISSE epoch. The white arrow shows the counterclockwise orbital motion. The dashed curves indicate the projected Roche lobes of the two stars. The 1 au scale is derived using the 180 ± 10 pc distance from Esseldeurs et al. (2025). The filled ellipse in the bottom left corner shows the resolution element.
Current usage metrics show cumulative count of Article Views (full-text article views including HTML views, PDF and ePub downloads, according to the available data) and Abstracts Views on Vision4Press platform.
Data correspond to usage on the plateform after 2015. The current usage metrics is available 48-96 hours after online publication and is updated daily on week days.
Initial download of the metrics may take a while.