| Issue |
A&A
Volume 706, February 2026
|
|
|---|---|---|
| Article Number | L1 | |
| Number of page(s) | 9 | |
| Section | Letters to the Editor | |
| DOI | https://doi.org/10.1051/0004-6361/202558298 | |
| Published online | 27 January 2026 | |
Letter to the Editor
Direct imaging of mass transfer and circumcompanion structures in π1 Gru with VLTI/MATISSE
1
European Southern Observatory Alonso de Córdova 3107 Vitacura Santiago, Chile
2
Division of Astronomy and Space Physics, Uppsala University Uppsala, Sweden
3
Department of Space, Earth and Environment, Chalmers University of Technology Göteborg, Sweden
4
Institut d’Astronomie et d’Astrophysique, Université libre de Bruxelles Bruxelles, Belgium
5
LIRA, Observatoire de Paris, Université PSL, Sorbonne Université, CNRS Paris, France
6
Centro de Astrobiologia (CAB), CSIC-INTA Madrid, Spain
7
Institute of Fundamental Physics (CSIC), Department of Molecular Astrophysics Madrid, Spain
8
Department of Astrophysics, University of Vienna Vienna, Austria
9
Université Côte d’Azur, Observatoire de la Côte d’Azur, CNRS, Laboratoire Lagrange Nice, France
10
Instituto de Astrofísica, Universidad Andrés Bello Santiago, Chile
11
Max Planck Institute for Radio Astronomy Bonn, Germany
12
European Southern Observatory Garching, Germany
13
Center for High Angular Resolution Astronomy, Georgia State University California, USA
14
Max-Planck-Institut für Astrophysik Garching, Germany
15
Schmidt Sciences New York, USA
16
HUN-REN Konkoly Observatory Budapest, Hungary
17
National Science Foundation Alexandria, USA
18
Universidad Nacional Autónoma de México, Instituto de Astronomía México City, Mexico
★ Corresponding author: This email address is being protected from spambots. You need JavaScript enabled to view it.
Received:
28
November
2025
Accepted:
4
January
2026
Abstract
Aims. We investigate how the presence of a binary companion appears to affect dust and molecule formation in the circumstellar environment of a star on the asymptotic giant branch (AGB).
Methods.L- and N-band observations obtained over the course of one month with the multi aperTure mid-infrared spectroScopic experiment instrument (MATISSE) at the very large telescope interferometer (VLTI) were used to constrain the distribution of dust and molecules in the close environment of π1 Gru through image reconstruction. The reconstructed images were fit to the interferometric observables, that is, the visibilities and closure phases, using the two Python-based tools Python for MiRA (PYRA) and mean astrophysical images with PYRA (MYTHRA) built around the multi-aperture image reconstruction algorithm (MiRA).
Results. Our observations support (i) a wind Roche-lobe overflow (WRLOF) scenario, where mass transfer from the AGB star to its companion produces a possible circumcompanion disk in the L band around π1 Gru C, with a central cavity that likely traces dust sublimation and a circumcompanion envelope in the N band. (ii) A main-sequence nature for the companion: Because both Atacama large millimeter/submillimeter array (ALMA) and the VLTI/MATISSE N-band observations show emission, we favor a thermal infrared emission from the main-sequence star over free-free emission from a with dwarf companion. Finally, (iii) a plume-like structure extending from π1 Gru C, likely marking the onset of the spiral observed at larger scales. Together, this provides direct evidence that links small-scale mass transfer and disk formation through WRLOF to the global circumstellar morphology.
Conclusions. These results highlight the atmospheric deformation induced by the companion, reveal ongoing mass transfer between the evolved star and its companion, and indicate a circumcompanion disk-like structure.
Key words: stars: AGB and post-AGB / stars: atmospheres / binaries: close / circumstellar matter / stars: imaging / stars: mass-loss
© The Authors 2026
 Open Access article, published by EDP Sciences, under the terms of the Creative Commons Attribution License (https://creativecommons.org/licenses/by/4.0), which permits unrestricted use, distribution, and reproduction in any medium, provided the original work is properly cited.
This article is published in open access under the Subscribe to Open model. This email address is being protected from spambots. You need JavaScript enabled to view it. to support open access publication.
1. Introduction
Asymptotic giant branch (AGB) stars are key contributors to the chemical enrichment of galaxies by injecting processed matter to the interstellar medium (ISM) via the mass-loss process. Theoretical models still face difficulties in accurately reproducing the mass-loss process, however, which is partially due to limited observational constraints (Groenewegen & Sloan 2018). The formation of dust and molecules in the atmosphere of AGBs remain poorly understood, especially in the presence of close companions (Decin et al. 2020; Danilovich et al. 2025). High-angular-resolution facilities operating at submilliarcsecond scales have revealed clumpy and strongly asymmetric structures in most of the inner circumstellar regions of AGB stars (Wittkowski et al. 2007; Ohnaka et al. 2016), suggesting that pulsations, shocks, convection, and binarity play a significant role in shaping the wind (Vlemmings et al. 2017; Velilla-Prieto et al. 2023; Danilovich et al. 2025). Moreover, three-dimensional radiation-hydrodynamic models of single stars also predict clumps and asymmetries in these regions (Wiegert et al. 2024), while binary interactions introduce additional structures such as spirals and arcs, which further affect the morphology of the outflows (Malfait et al. 2024b). This work focuses on the triple system of the S-type AGB star pi Gru. π1 Gru A (the central star) has an H-band photospheric angular diameter of 18.37 ± 0.18 mas (2 R★ = 3.3 au.) and an effective temperature of Teff = 3200 K (Paladini et al. 2017). The MID-infrared Interferometric instrument (MIDI) observations show a dense, extended molecular outer atmosphere up to 4.4 R★ that is composed of oxygen-bearing molecules (H2O, SiO), which serves as a precursor to the observed thin dust shell composed of 70% warm silicates and 30% Al2O3 grains (Sacuto et al. 2008). Atacama large millimeter/submillimeter array (ALMA) observations revealed a dusty torus, a bipolar outflow, and a spiral structure at larger scales in the circumstellar envelope that are likely caused by binary interactions (Doan et al. 2017, 2020; Homan et al. 2020). π1 Gru B is a G0V-type companion separated from π1 Gru A by 2.8 arcsec (Feast 1953; Wycoff et al. 2006). π1 Gru B is outside the field of view of the observations we present here. The system includes a close companion, π Gru C, which orbits at 38 mas (6.81 ± 0.49 au) from π Gru A. Esseldeurs et al. (2025) derived a circular orbit with a period of 11.76 ± 1.85 yr and a companion mass of 1.12 ± 0.25 M⊙. The nature of the close companion, white dwarf (WD) or a main-sequence (MS) star, is a matter of debate Montargès et al. (2025), Esseldeurs et al. (2025). This work is focused on the effect of the closest companion (π1 Gru C) on the molecule and dust distribution in the close environment of π1 Gru A using VLTI/MATISSE interferometric data in the L and N bands.
2. Observations
2.1. Data acquisition
The π1 Gru data were obtained using the very large telescope interferometer (VLTI) and the multi aperTure mid-infrared spectroScopic experiment (MATISSE) instrument (Lopez et al. 2022). The data are part of the VLTI/MATISSE BIN-AGB Large Program (ID 108.22E9), which aims to image the close environments of evolved stars that are thought to host stellar companions. The VLTI/MATISSE standalone observations of π1 Gru were acquired at medium spectral resolution (R = 506) in the L band (4.02–4.17 μm) and at low spectral resolution (R = 30) in the N band (7.90–13.00 μm). The source is bright and complex, and auxiliary telescopes (ATs) were therefore employed in four different configurations: small (A0-B2-D0-C1), medium (K0-G2-D0-J3), and large (A0-G1-J2-J3, and A0-B2-D0-J3). These configurations allowed an efficient (u, v)-plane coverage (see Fig. A.1) that was suitable for image reconstruction.
The observations span multiple nights over one month and cover approximately 15% of the π1 Gru A 195-day pulsation period (Mayer et al. 2014). Over this timescale, the circumstellar environment is assumed to be stable at the MATISSE wavelengths. No changes are expected due to the close binary orbital period of about 11 years (Esseldeurs et al. 2025). Consequently, the data were merged for the analysis. All observations we used are summarized in Tables A.1 and A.2. Calibrator stars were selected to be free of infrared excess and variability (Cruzalèbes et al. 2019). The data reduction and calibration were performed using version 2.0.2 of the ESO MATISSE pipeline1 with the consortium Python wrapper mat-tools version 0.62.
2.2. First overview of the data
Appendix B presents the calibrated VLTI/MATISSE L- and N-band spectra. They reveal a chemically rich and complex circumstellar environment. Appendix C shows the squared visibilities and closure phases in the L and N bands. In the L band (Appendix C, panels a–c), high visibilities at short spatial frequencies might indicate negligible contributions from over-resolved components or background emission. The visibility profile extends to the third lobe, which confirms that the central object is well resolved. Closure phases near zero at short spatial frequencies but significant deviation at higher frequencies reveal asymmetries that are smaller than the overall shape of the star. In the N band (Appendix C, panels d–f), the dispersion of the visibilities and closure phases already seen from the first lobe indicates strong departure from the single-disk geometry. Image reconstruction is thus essential to constrain the geometry of the circumstellar environment of π1 Gru A.
This study focuses on six spectral features: a pseudo-continuum at 4.033 μm, SiO absorption bands at 4.043 μm (SiOa) and 4.084 μm (SiOc), a combined SiO+H2O feature at 8.4 μm, and two dust-emission features at 9.8 μm (Dust1) and 11.0 μm (Dust2). The spectral features were identified following Aringer et al. (1997) and Sacuto et al. (2008). Spectral windows were defined after data reduction by combining wavelength ranges over which the interferometric observables remain constant.
3. Image reconstructions: Morphological analysis
The detailed description of the reconstruction process is available in Appendix D. We describe the main structures that are visible in our reconstructed images for both bands briefly here, as shown in Fig 1. In both bands, the minimum dynamic threshold for trusting the structures is about 10% of the maximum intensity (computed using a 5σ threshold derived from the MAD-based noise estimate). The main structures observed in the N-band images (Fig. 1, bottom row) are (i) the star seen as a Gaussian-like central source, elongated in the west and northwest direction, and (ii) an elongated disk-like structure in the northwest direction around the companion. In the L band, the pattern of low-contrast blobs that form a spiral around the central star suggests that this structure is an artifact caused by gaps in the (u,v)-plane coverage. Therefore, the main structures observed in the images (Fig. 1, top row) are (i) a nonuniform intensity within the stellar angular diameter of the source with a main bright spot in the photosphere at the center that corresponds to twice the mean intensity within the stellar disk, (ii) an irregular stellar atmosphere pointing west and northwest, and (iii) a disk-like structure at the same position as in the N band.
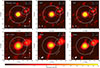 |
Fig. 1. Square-root intensity maps of the reconstructed images of π1 Gru. From left to right and top to bottom, the panels show the pseudo-continuum (4.033 μm), the SiO absorption bands SiOa (4.043 μm) and SiOc (4.084 μm), the combined SiO+H2O feature (8.4 μm), and the dust-emission features Dust1 (9.8 μm) and Dust2 (11.0 μm). The blue circle marks the H-band photospheric angular diameter of π1 Gru A (Paladini et al. 2017) and serves as a reference angular diameter for comparison with the larger sizes observed in the L and N bands. The white curve traces the orbit of the close companion π1 Gru C (Esseldeurs et al. 2025), with the blue dot and associated bars indicating its expected position and uncertainties at the MATISSE epoch. The white arrow shows the counterclockwise orbital motion. The dashed curves indicate the projected Roche lobes of the two stars. The 1 au scale is derived using the 180 ± 10 pc distance from Esseldeurs et al. (2025). The filled ellipse in the bottom left corner shows the resolution element. |
4. Discussion
4.1. Chemical composition of the π1 Gru environment
Chemical equilibrium models indicate that SiO molecules form within O-rich atmospheres (Tsuji 1973) and are abundant in the 1–5 R★ region, prior to efficient silicate dust condensation (Agúndez et al. 2020). In the L band, the visibility differences between SiOa and SiOc relative to the pseudo-continuum are small, which results in small variations in the stellar angular diameter. The subtraction of the pseudo-continuum image (Fig. D.1) from the SiO image highlights an asymmetric SiO extension toward the binary companion, however, as well as a circumstellar environment that is globally affected by irregular SiO patches/clumps.
Sacuto et al. (2008) modeled their N-band MIDI data with a SiO+H2O shell extending up to 4.4 R★. This large apparent size likely arises because their data included the central star and the binary companion within a single SiO+H2O shell. While the SiO+H2O contribution becomes marginal at longer wavelengths (Sacuto et al. 2008), our images clearly resolve the stellar and circumcompanion environments as distinct components in Dust1 and Dust2. Both regions show evidence of a mixture of SiO, H2O, silicates, and alumina, although the close environment around the star, within ∼1.5 R★, is more likely dominated by alumina because silicate condensation is not expected at these small radii (Höfner et al. 2016). A detailed modeling of the data presented here is beyond the scope of this work.
4.2. Location, nature, and mass transfer of π1 Gru C
Figure 1 shows the orbit of π1 Gru C from Esseldeurs et al. (2025) superimposed on the MATISSE images. The expected position of the companion (blue dot) coincides with the observed blob reported in the previous section. Although the nature of π1 Gru C (WD or MS; Montargès et al. 2025; Esseldeurs et al. 2025) remains uncertain, the mid-infrared emission of the disk-like structure in the N band favors dust emission over free-free emission, and thus, the MS scenario, which is also supported by Esseldeurs et al. (2025) and Montargès et al. (2025).
Wind Roche-lobe overflow (WRLOF) is a mass-transfer mechanism in long-period binary systems in which a slow, dense stellar wind is efficiently captured by the gravitational potential of a companion. We specifically considered the case of an AGB donor. Therefore, WRLOF occurs when the dust condensation radius lies close to the Roche lobe of the primary (Mohamed & Podsiadlowski 2007). For iron-free silicates (Tcond ≈ 1000 K), the condensation radius of our system is Rcond ≈ 2 R★ ≈ 3.3 au. With R★ ≈ 1.65 au (18.37 mas at 180 pc; Paladini et al. 2017; Esseldeurs et al. 2025) and an orbital separation of 6.81 au, the Roche-lobe radius is ∼ 2.6 au. Since Rcond lies near this limit, the WRLOF condition is fulfilled. This enables efficient mass transfer to the companion.
In the L- and N-band images, the photosphere of π1 Gru A appears to be elongated westward toward the companion (Fig. D.1). We speculate that this elongation traces the WRLOF, and in this particular configuration, a disk of material might form around the companion with an angular diameter of ∼ 1 au and temperatures within the accretion disk that can reach ∼ 104 K (Malfait et al. 2024a). This is sufficiently high to destroy dust grains and prevent their formation. The L-band images (Fig. 1 and Fig. 2) show a central hole at all wavelengths, with a size comparable to the dirty beam (∼ 1 au). This is required to reproduce the high spatial frequency visibilities and fit the observations. This hole probably traces a hotter region in which dust and molecules cannot survive. In contrast, the N-band images reveal surviving molecules and dust near π1 Gru C. Either the N-band resolution might be insufficient to reproduce the possible cavity seen in the L band, or we are likely imaging an outer envelope surrounding the disk-like structure, however, where lower temperatures allow dust to persist. In addition, the best reconstruction (Dust2, Fig. 1), selected as the image with the lowest χ2 for the visibilities and the closure phases, reveals a plume-like feature that extends westward from the blob. This suggests that localized dust around the companion might feed the larger-scale outflow seen with SPHERE/ZIMPOL (Montargès et al. 2023). When we rotate our image so that it aligns with the time of the observations of Montargès et al. (2023), the plume and trailing dust structures are spatially consistent (Fig. 3). This supports the hypothesis that the elongation is real.
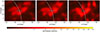 |
Fig. 2. Zoom into the L-band image reconstructions from Fig. 1, focusing on the disk-like structure surrounding π1 Gru C. From left to right: the pseudo-continuum (4.033 μm), the SiO absorption bands SiOa (4.043 μm) and SiOc (4.084 μm). Blue bars indicate the positional uncertainties of the companion. |
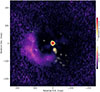 |
Fig. 3. Linear intensity distribution of SPHERE/ZIMPOL (purple; Montargès et al. 2023) and our best N-band reconstruction: Dust2 (yellow/red), rotated to match the observation epoch of SPHERE. |
5. Conclusion
Our VLTI/MATISSE observations of π1 Gru resolve SiO (L band), silicates, alumina, and SiO+H2O (N band) structures and reveal a localized emission around the expected location of π1 Gru C. This suggests a physical association between the main star and the companion. The thermal dust emission favors a main-sequence star. Image reconstructions support a WRLOF scenario, with the AGB wind focused toward π1 Gru C and forming a dust disk with a possible hole observed in the L band. Surviving dust indicates cooler outer regions and not a hot accretion disk, and a westward plume might trace the onset of trailing dust structures. These results highlight the interplay of binary interaction, dust formation, and mass loss. Future interferometric observations are needed to constrain the evolution of the companion environment and the accretion structures.
Acknowledgments
J.D. acknowledges the support from the ESO Fellowship Programme. This work made use of the Jean-Marie Mariotti Center SearchCal service (http://www.jmmc.fr/searchcal), co-developed by LAGRANGE and IPAG, and of the CDS databases SIMBAD and VIZIER (http://cdsweb.u-strasbg.fr). We thank A. Labdon, X. Haubois (night astronomers), and L. Rivas, J. Velasquez, L. Faundez (Telescope/Instrument Operators) for the excellent data obtained at Cerro Paranal. S. Höfner acknowledges ERC funding (EXWINGS, No. 883867) and the Swedish Research Council (2019-04059). K. Ohnaka acknowledges ANID/FONDECYT 1240301. J.S.-B. acknowledges UNAM DGAPA-PAPIIT AG 101025. C.S.C. and J.A.H. are supported by MCIN/AEI project PID2023-146056NB-C22. This publication is part of grant RYC2023-045648-I (MICIU/AEI/ESF+). J.P.F. acknowledges MICIU funding (PID2023-147545NB-I00).
References
- Agúndez, M., Martínez, J. I., de Andres, P. L., et al. 2020, A&A, 637, A59 [CrossRef] [EDP Sciences] [PubMed] [Google Scholar]
- Aringer, B., Jorgensen, U. G., & Langhoff, S. R. 1997, A&A, 323, 202 [Google Scholar]
- Cruzalèbes, P., Petrov, R. G., Robbe-Dubois, S., et al. 2019, MNRAS, 490, 3158 [Google Scholar]
- Danilovich, T., Samaratunge, N., Mori, Y. L., et al. 2025, A&A, 704, A341 [NASA ADS] [CrossRef] [EDP Sciences] [Google Scholar]
- Decin, L., Montargès, M., Richards, A. M. S., et al. 2020, Science, 369, 1497 [Google Scholar]
- Doan, L., Ramstedt, S., Vlemmings, W. H. T., et al. 2017, A&A, 605, A28 [NASA ADS] [CrossRef] [EDP Sciences] [Google Scholar]
- Doan, L., Ramstedt, S., Vlemmings, W. H. T., et al. 2020, A&A, 633, A13 [NASA ADS] [CrossRef] [EDP Sciences] [Google Scholar]
- Esseldeurs, M., Decin, L., Ridder, J. D., et al. 2025, Nat. Astron., in press [Google Scholar]
- Feast, M. W. 1953, MNRAS, 113, 510 [NASA ADS] [CrossRef] [Google Scholar]
- Groenewegen, M. A. T., & Sloan, G. C. 2018, A&A, 609, A114 [NASA ADS] [CrossRef] [EDP Sciences] [Google Scholar]
- Höfner, S., Bladh, S., Aringer, B., & Ahuja, R. 2016, A&A, 594, A108 [NASA ADS] [CrossRef] [EDP Sciences] [Google Scholar]
- Homan, W., Montargès, M., Pimpanuwat, B., et al. 2020, A&A, 644, A61 [NASA ADS] [CrossRef] [EDP Sciences] [Google Scholar]
- Lopez, B., Lagarde, S., Petrov, R. G., et al. 2022, A&A, 659, A192 [NASA ADS] [CrossRef] [EDP Sciences] [Google Scholar]
- Malfait, J., Siess, L., Esseldeurs, M., et al. 2024a, A&A, 691, A84 [Google Scholar]
- Malfait, J., Siess, L., Vermeulen, O., et al. 2024b, A&A, 691, A57 [NASA ADS] [CrossRef] [EDP Sciences] [Google Scholar]
- Mayer, A., Jorissen, A., Paladini, C., et al. 2014, A&A, 570, A113 [NASA ADS] [CrossRef] [EDP Sciences] [Google Scholar]
- Mohamed, S., & Podsiadlowski, P. 2007, ASPCS, 372, 397 [Google Scholar]
- Montargès, M., Cannon, E., de Koter, A., et al. 2023, A&A, 671, A96 [NASA ADS] [CrossRef] [EDP Sciences] [Google Scholar]
- Montargès, M., Malfait, J., Esseldeurs, M., et al. 2025, A&A, 699, A22 [NASA ADS] [CrossRef] [EDP Sciences] [Google Scholar]
- Ohnaka, K., Weigelt, G., & Hofmann, K. H. 2016, A&A, 589, A91 [NASA ADS] [CrossRef] [EDP Sciences] [Google Scholar]
- Paladini, C., Klotz, D., Sacuto, S., et al. 2017, A&A, 600, A136 [NASA ADS] [CrossRef] [EDP Sciences] [Google Scholar]
- Sacuto, S., Jorissen, A., Cruzalèbes, P., et al. 2008, A&A, 482, 561 [NASA ADS] [CrossRef] [EDP Sciences] [Google Scholar]
- Thiébaut, E. 2008, SPIE, 7013, 70131I [Google Scholar]
- Tsuji, T. 1973, A&A, 23, 411 [NASA ADS] [Google Scholar]
- Velilla-Prieto, L., Fonfría, J. P., Agúndez, M., et al. 2023, Nature, 617, 696 [NASA ADS] [CrossRef] [Google Scholar]
- Vlemmings, W., Khouri, T., O’Gorman, E., et al. 2017, Nat. Astron., 1, 848 [NASA ADS] [CrossRef] [Google Scholar]
- Wiegert, J., Freytag, B., & Höfner, S. 2024, A&A, 690, A162 [NASA ADS] [CrossRef] [EDP Sciences] [Google Scholar]
- Wittkowski, M., Boboltz, D. A., Ohnaka, K., et al. 2007, A&A, 470, 191 [NASA ADS] [CrossRef] [EDP Sciences] [Google Scholar]
- Wycoff, G. L., Mason, B. D., & Urban, S. E. 2006, AJ, 132, 50 [Google Scholar]
Appendix A: Observation logs
Log of the MATISSE observations of π1 Gru.
Properties of the calibrators from the Mid-infrared stellar Diameters and Fluxes compilation Catalogue (MDFC) catalog (Cruzalèbes et al. 2019) used to calibrate the data.
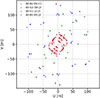 |
Fig. A.1. (u, v)-plane coverage of the VLTI/MATISSE data obtained during the observations with the small (A0-B2-D0-C1), medium (K0-G2-D0-J3), large (A0-G1-J2-J3, and A0-B2-D0-J3) AT configurations. |
Appendix B: Calibrated spectra from MATISSE
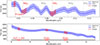 |
Fig. B.1. Top: Calibrated MATISSE spectrum of the L-band data with, from left to right, the pseudo-continuum (P-Cont.), SiOa: a mixture of the SiO (v = 2 → 0) and SiO (v = 3 → 1) rotational-vibrational band-heads, SiOb: SiO (v = 3 → 1), SiOc: a mixture of SiO (v = 4 → 2) and SiO (v = 3 → 1), SiOd: SiO (v = 4 → 2), and SiOe: a mixture of SiO (v = 5 → 3) and SiO (v = 4 → 2). Bottom: Calibrated MATISSE spectrum of the N-band data with the main chemical elements contributing to the emission on top of the continuum estimated by Sacuto et al. (2008) with Dust1 and Dust2 corresponding to both a mixture of silicates and alumina. For each band, the red section represents the part of the spectrum used to make the various image reconstructions. For the L band the vertical dashed lines represent the central part of the respective spectral absorption signature. |
Appendix C: Image reconstructions and data comparison
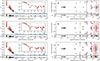 |
Fig. C.1. Representation of the MATISSE observations (orange) and the MiRA reconstructed observables (blue) for the pseudo-continuum (a, top row), SiOa (b, middle row), and SiOc (c, bottom row). For each panel, the left plot shows the squared visibilities (with a logarithmic inset in the top-right corner), and the right plot shows the comparison between the observed and reconstructed closure phase. |
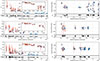 |
Fig. C.2. Representation of the MATISSE observations (orange) and MiRA reconstructed observables (blue) for H2O+SiO bands (d, top row) and two different bands in the Silicates + Al2O3 spectral regions (e and f respectively middle and bottom row). For each panel, the left plot shows the squared visibilities (with a logarithmic inset in the top-right corner), and the right plot shows the comparison between the observed and reconstructed closure phase. |
Appendix D: Image reconstructions
Image reconstructions were performed using two Python-based tools built around the multi-aperture image reconstruction algorithm (MiRA, Thiébaut 2008): PYRA (Python for MiRA)3 and MYTHRA (mean astrophysical images with PYRA4; Drevon et al. in prep.). Images were first reconstructed from optical interferometric data using the MiRA algorithm, which fits model images to observed visibilities and closure phases. Then, the PYRA Python-based tool was used to automatically generate a large set of image reconstructions (1000 in this study), by varying key parameters such as field of view, pixel scale, and the weight of an image prior. In particular, a smoothness constraint was applied, which favors a smooth intensity gradient rather than abrupt. This approach helps guide the reconstruction despite the incomplete and noisy nature of interferometric data, a process known as regularization: it introduces additional information or assumptions to stabilize the solution. The MYTHRA package then find an image subset which fits the optimal balance between fitting the data and enforcing this regularization. Then MYTHRA processes this subset, remove outliers, and compute the final representative image by averaging the remaining reconstructions. The effective resolution (dirty beam) was modeled as an ellipse: 4×2 mas in the L band and 9×5 mas in the N band. To prevent artifacts, the pixel scale was set smaller than half the instrument resolution, i.e., 0.5 × λ/(2B). The final L- and N-band images and their corresponding visibility and closure phase fits are shown in Appendix C.
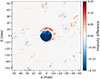 |
Fig. D.1. Pseudo-continuum image subtracted from the SiOa after a flux normalization with respect to the MATISSE spectrum. |
All Tables
Properties of the calibrators from the Mid-infrared stellar Diameters and Fluxes compilation Catalogue (MDFC) catalog (Cruzalèbes et al. 2019) used to calibrate the data.
All Figures
|
Fig. 1. Square-root intensity maps of the reconstructed images of π1 Gru. From left to right and top to bottom, the panels show the pseudo-continuum (4.033 μm), the SiO absorption bands SiOa (4.043 μm) and SiOc (4.084 μm), the combined SiO+H2O feature (8.4 μm), and the dust-emission features Dust1 (9.8 μm) and Dust2 (11.0 μm). The blue circle marks the H-band photospheric angular diameter of π1 Gru A (Paladini et al. 2017) and serves as a reference angular diameter for comparison with the larger sizes observed in the L and N bands. The white curve traces the orbit of the close companion π1 Gru C (Esseldeurs et al. 2025), with the blue dot and associated bars indicating its expected position and uncertainties at the MATISSE epoch. The white arrow shows the counterclockwise orbital motion. The dashed curves indicate the projected Roche lobes of the two stars. The 1 au scale is derived using the 180 ± 10 pc distance from Esseldeurs et al. (2025). The filled ellipse in the bottom left corner shows the resolution element. |
| In the text | |
|
Fig. 2. Zoom into the L-band image reconstructions from Fig. 1, focusing on the disk-like structure surrounding π1 Gru C. From left to right: the pseudo-continuum (4.033 μm), the SiO absorption bands SiOa (4.043 μm) and SiOc (4.084 μm). Blue bars indicate the positional uncertainties of the companion. |
| In the text | |
|
Fig. 3. Linear intensity distribution of SPHERE/ZIMPOL (purple; Montargès et al. 2023) and our best N-band reconstruction: Dust2 (yellow/red), rotated to match the observation epoch of SPHERE. |
| In the text | |
|
Fig. A.1. (u, v)-plane coverage of the VLTI/MATISSE data obtained during the observations with the small (A0-B2-D0-C1), medium (K0-G2-D0-J3), large (A0-G1-J2-J3, and A0-B2-D0-J3) AT configurations. |
| In the text | |
|
Fig. B.1. Top: Calibrated MATISSE spectrum of the L-band data with, from left to right, the pseudo-continuum (P-Cont.), SiOa: a mixture of the SiO (v = 2 → 0) and SiO (v = 3 → 1) rotational-vibrational band-heads, SiOb: SiO (v = 3 → 1), SiOc: a mixture of SiO (v = 4 → 2) and SiO (v = 3 → 1), SiOd: SiO (v = 4 → 2), and SiOe: a mixture of SiO (v = 5 → 3) and SiO (v = 4 → 2). Bottom: Calibrated MATISSE spectrum of the N-band data with the main chemical elements contributing to the emission on top of the continuum estimated by Sacuto et al. (2008) with Dust1 and Dust2 corresponding to both a mixture of silicates and alumina. For each band, the red section represents the part of the spectrum used to make the various image reconstructions. For the L band the vertical dashed lines represent the central part of the respective spectral absorption signature. |
| In the text | |
|
Fig. C.1. Representation of the MATISSE observations (orange) and the MiRA reconstructed observables (blue) for the pseudo-continuum (a, top row), SiOa (b, middle row), and SiOc (c, bottom row). For each panel, the left plot shows the squared visibilities (with a logarithmic inset in the top-right corner), and the right plot shows the comparison between the observed and reconstructed closure phase. |
| In the text | |
|
Fig. C.2. Representation of the MATISSE observations (orange) and MiRA reconstructed observables (blue) for H2O+SiO bands (d, top row) and two different bands in the Silicates + Al2O3 spectral regions (e and f respectively middle and bottom row). For each panel, the left plot shows the squared visibilities (with a logarithmic inset in the top-right corner), and the right plot shows the comparison between the observed and reconstructed closure phase. |
| In the text | |
|
Fig. D.1. Pseudo-continuum image subtracted from the SiOa after a flux normalization with respect to the MATISSE spectrum. |
| In the text | |
Current usage metrics show cumulative count of Article Views (full-text article views including HTML views, PDF and ePub downloads, according to the available data) and Abstracts Views on Vision4Press platform.
Data correspond to usage on the plateform after 2015. The current usage metrics is available 48-96 hours after online publication and is updated daily on week days.
Initial download of the metrics may take a while.