Fig. C.1.
Download original image
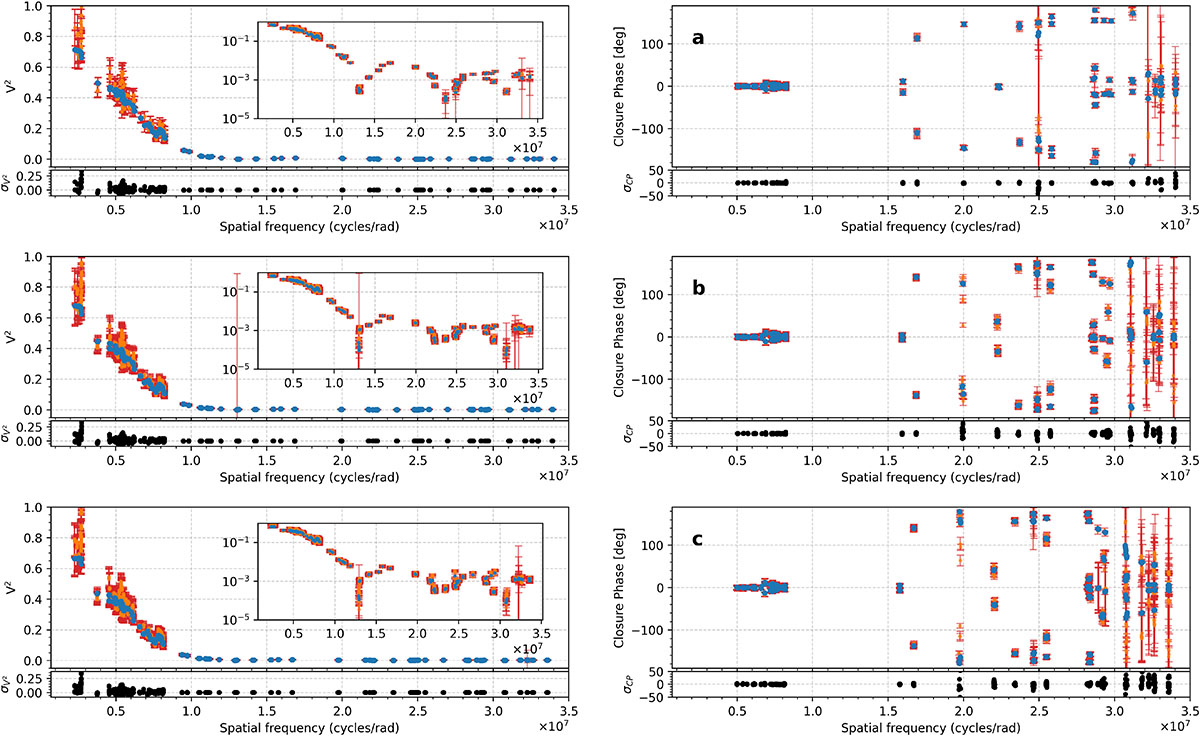
Representation of the MATISSE observations (orange) and the MiRA reconstructed observables (blue) for the pseudo-continuum (a, top row), SiOa (b, middle row), and SiOc (c, bottom row). For each panel, the left plot shows the squared visibilities (with a logarithmic inset in the top-right corner), and the right plot shows the comparison between the observed and reconstructed closure phase.
Current usage metrics show cumulative count of Article Views (full-text article views including HTML views, PDF and ePub downloads, according to the available data) and Abstracts Views on Vision4Press platform.
Data correspond to usage on the plateform after 2015. The current usage metrics is available 48-96 hours after online publication and is updated daily on week days.
Initial download of the metrics may take a while.