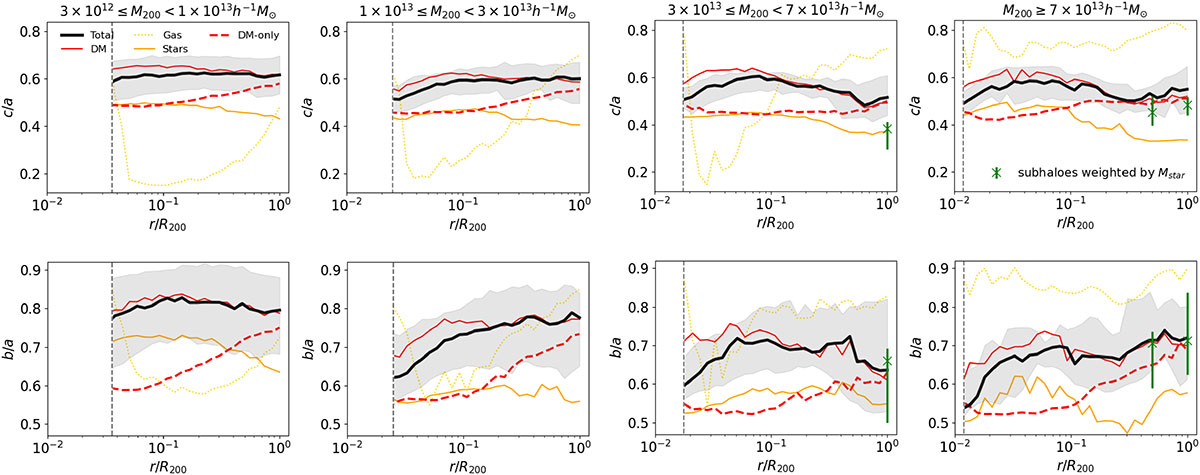
Fig. 2.
Download original image
Median profiles of minor-to-major (top) and intermediate-to-major (bottom) axis ratios for z = 0 halos in the CDM simulation in bins of increasing mass (from left to right). Solid black curves show the total axis ratios in the FP run, while solid red, dotted gold, and solid orange curves show the corresponding results for the DM, gas, and stars, respectively. Dashed red curves show halos in the same mass bins but for the DMO run. Green data points (shown only in some of the boxes) include the satellites and were weighted by stellar mass when computing the inertial mass tensor. The error bars bracket 25% and 75% of the distribution. The vertical bars display the resolution limit, which is equal to 10 times the softening length. The number of halos present in the four considered mass bins is 305, 78, 34, and 14, respectively.
Current usage metrics show cumulative count of Article Views (full-text article views including HTML views, PDF and ePub downloads, according to the available data) and Abstracts Views on Vision4Press platform.
Data correspond to usage on the plateform after 2015. The current usage metrics is available 48-96 hours after online publication and is updated daily on week days.
Initial download of the metrics may take a while.