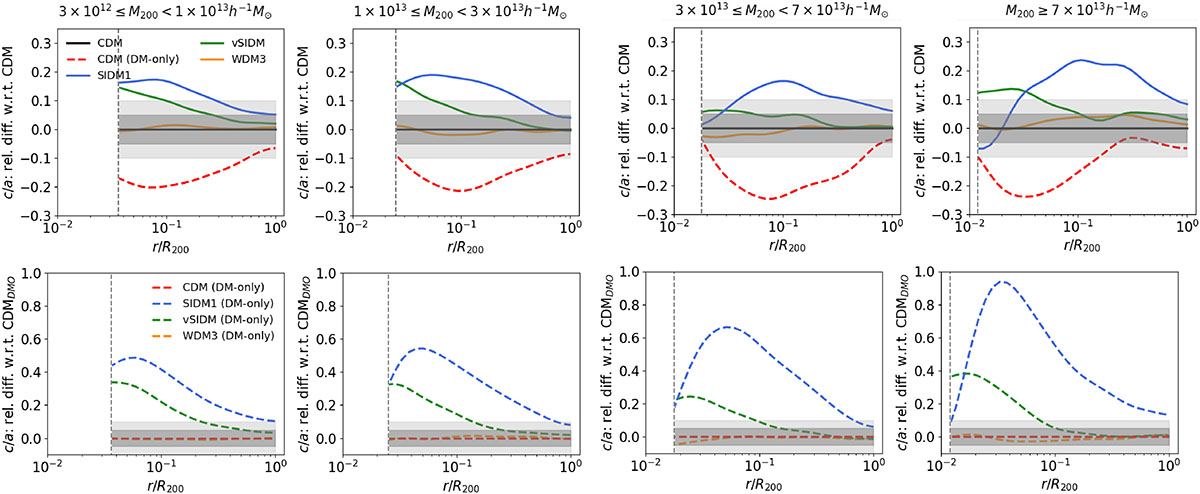
Fig. 3.
Download original image
Minor-to-major axis ratios for the DM models relative to the CDM value, for the same (z = 0) mass bins as in Fig. 2. Top and bottom panels display the results from FP and DMO runs, respectively. The dark and light gray shaded regions in all panels indicate 5% and 10% differences, respectively. In dashed red we display the case of the CDM DMO simulation
Current usage metrics show cumulative count of Article Views (full-text article views including HTML views, PDF and ePub downloads, according to the available data) and Abstracts Views on Vision4Press platform.
Data correspond to usage on the plateform after 2015. The current usage metrics is available 48-96 hours after online publication and is updated daily on week days.
Initial download of the metrics may take a while.