Fig. 4.
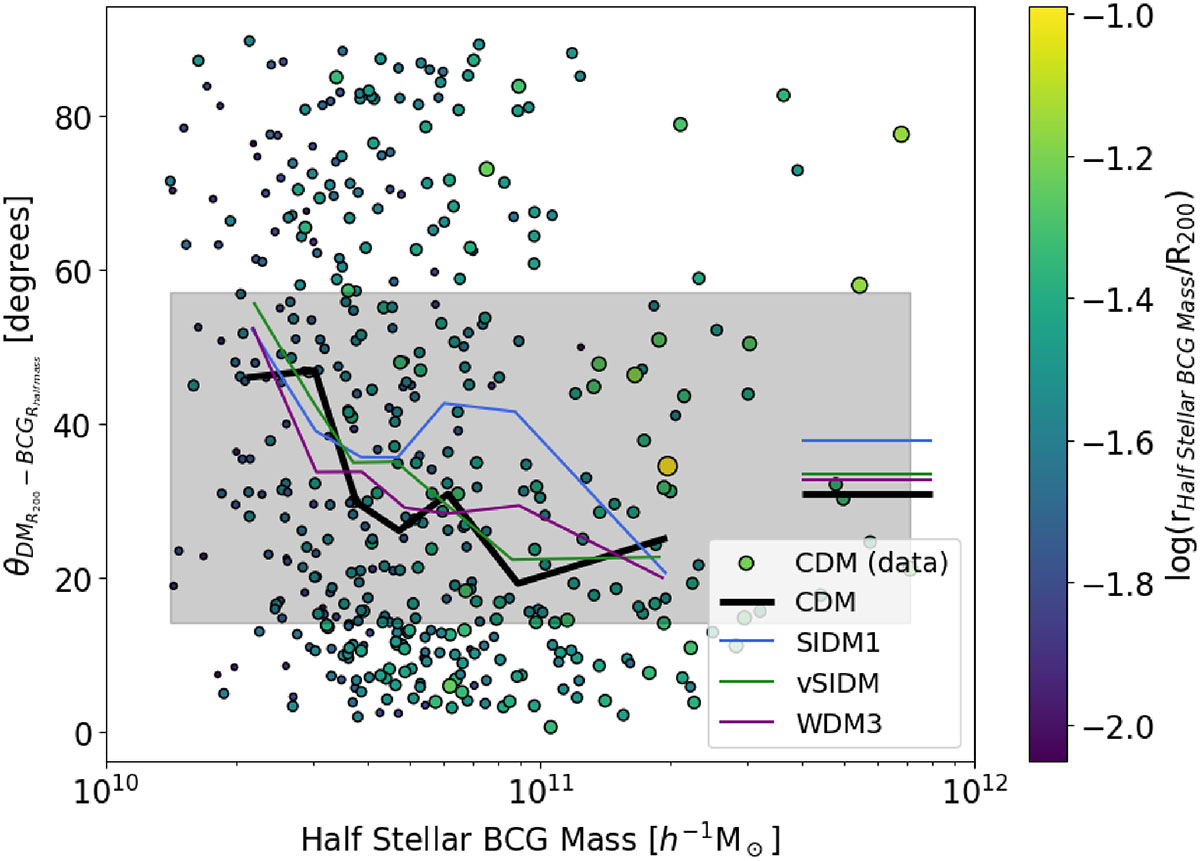
Download original image
Median misalignment angles, as a function of the rescaled radius, of DM (red) and gas (orange) with respect to the star particles (yellow), in the AIDA-TNG simulations. Dashed, dot-dashed, and dotted lines refer to SIDM1, vSIDM, and WDM3 simulations, respectively, and the four panels are for the same mass bins as in Fig. 2. The colored shaded regions bracket the central 50% (i.e., between 25% and 75%) of the CDM measurements. The four panels represent the four mass bins presented in Fig. 2
Current usage metrics show cumulative count of Article Views (full-text article views including HTML views, PDF and ePub downloads, according to the available data) and Abstracts Views on Vision4Press platform.
Data correspond to usage on the plateform after 2015. The current usage metrics is available 48-96 hours after online publication and is updated daily on week days.
Initial download of the metrics may take a while.