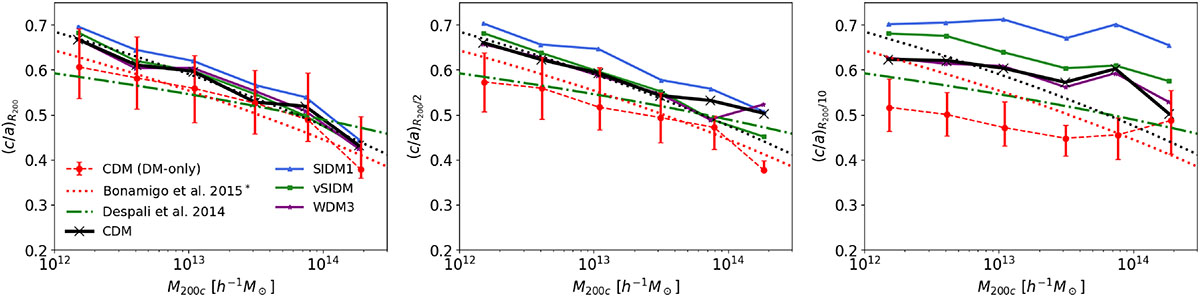
Fig. 6.
Download original image
Minor-to-major axis ratios as a function of the halo mass (M200). Red data points display the median relation for the CDM DMO simulation at z = 0, while the corresponding solid error bars bracket 25 and 75% of the distribution at fixed halo mass. The connected black, blue, green, and magenta data points show the results for the FP runs in different DM models. To avoid overcrowding, they are displayed without the error bars. The left, central, and right panels show the measurements at the halo boundary radius R200, R200/2, and R200/10, respectively. The dot-dashed green curve shows the results from Despali et al. (2014), while the dotted red and black lines show the best-fit relation assuming the median value of the Bonamigo et al. (2015) model at (c/a)R200 ; this is repeated in all three panels as a guide.
Current usage metrics show cumulative count of Article Views (full-text article views including HTML views, PDF and ePub downloads, according to the available data) and Abstracts Views on Vision4Press platform.
Data correspond to usage on the plateform after 2015. The current usage metrics is available 48-96 hours after online publication and is updated daily on week days.
Initial download of the metrics may take a while.