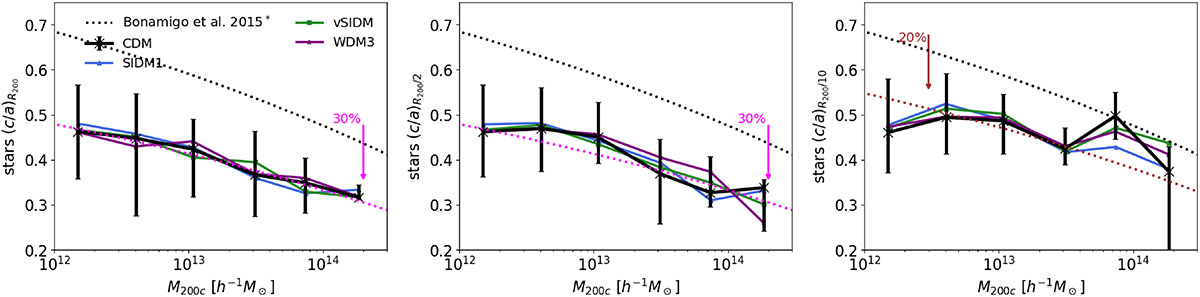
Fig. 7.
Download original image
Median minor-to-major axis ratios as a function of the halo mass (M200) considering only star particles for halos at z = 0. The connected black, blue, green, and magenta data points exhibit the results for the FP runs considering different DM models. Error bars bracket 25 and 75% of the distribution, displayed only for the CDM case. The left, central, and right panels show the measurements at the halo boundary radius (R200) and at 50% and 10% of its value, respectively. The dotted black curve shows the recalibrated Bonamigo et al. (2015) model for the (c/a)R200 as measured from all particles in the CDM run. The arrows in each panel indicate the percentage shift of the total-matter c/a relation required to match the minor-to-major axis ratios of the stellar component as a function of halo mass.
Current usage metrics show cumulative count of Article Views (full-text article views including HTML views, PDF and ePub downloads, according to the available data) and Abstracts Views on Vision4Press platform.
Data correspond to usage on the plateform after 2015. The current usage metrics is available 48-96 hours after online publication and is updated daily on week days.
Initial download of the metrics may take a while.