Fig. 1.
Download original image
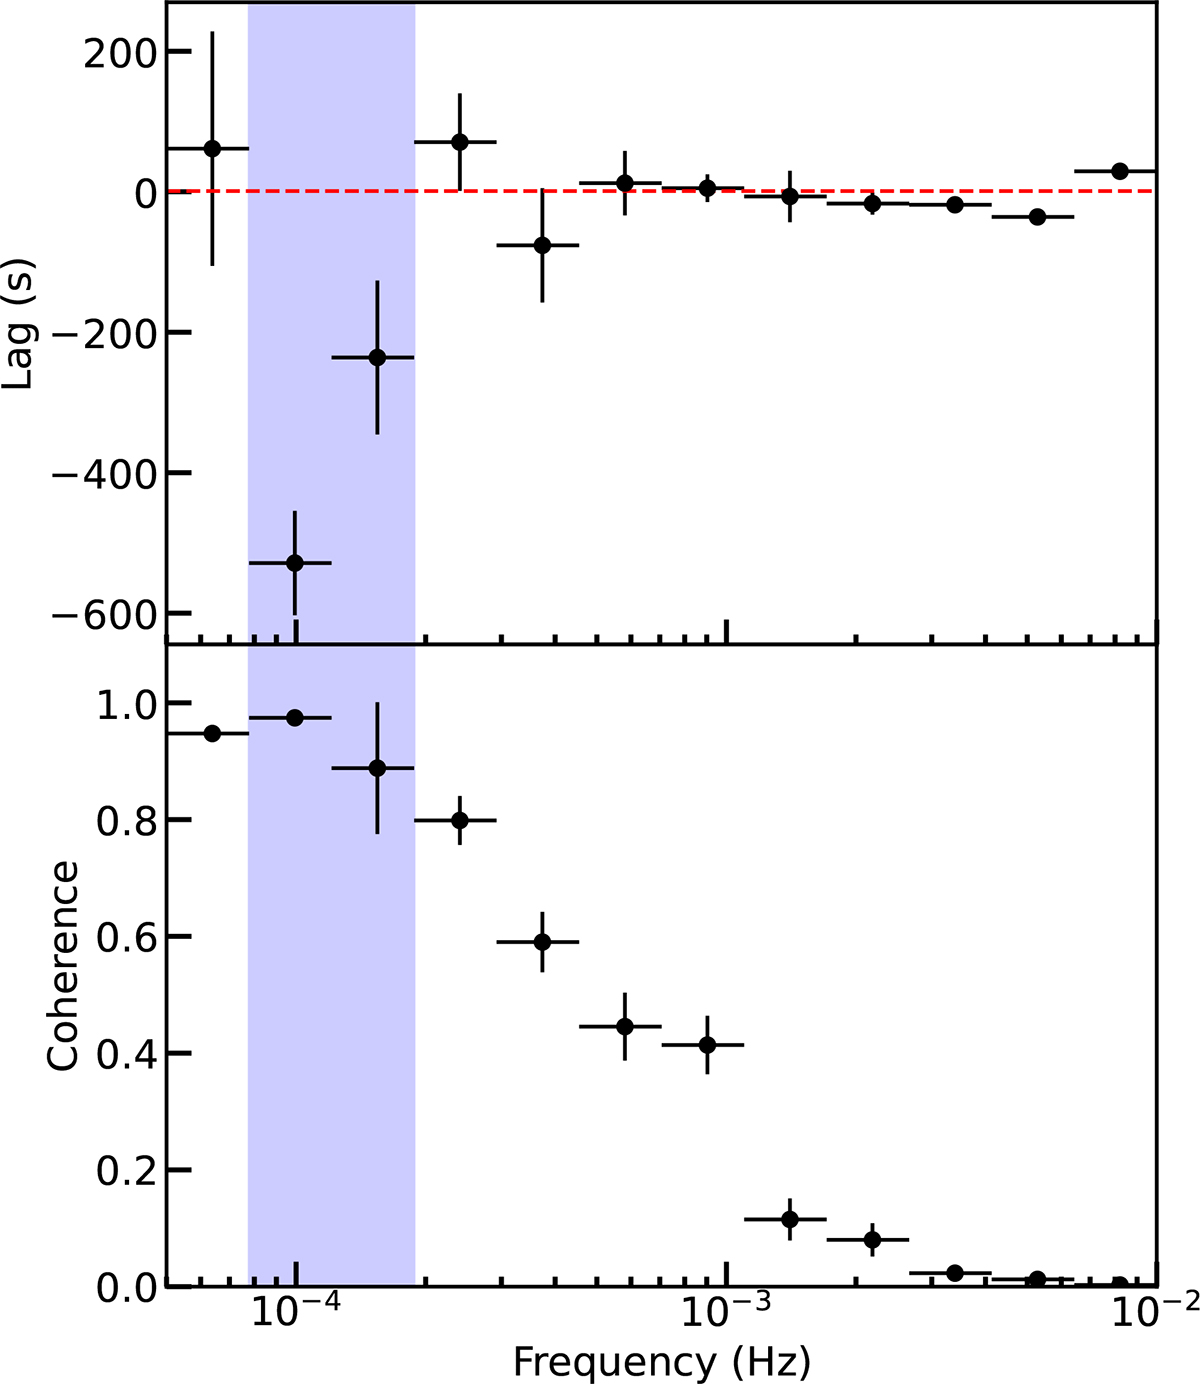
Top panel: Soft (0.3–0.7 keV) versus hard (0.9–10 keV) lags as a function of temporal frequency. By convention, negative lags correspond to the soft band lagging behind the hard band. Variability on timescales of 104 s shows a soft lag of approximately 500 s. Bottom panel: Coherence as a function of frequency between the 0.3–0.7 and 0.9–10 keV bands. The blue-shaded region highlights the frequency range in which the soft band lags the hard band, during which the coherence remains close to 1. The blue-shaded frequency range was used to construct the energy–lag spectrum and the covariance spectrum. All statistical errors correspond to the 90% confidence level.
Current usage metrics show cumulative count of Article Views (full-text article views including HTML views, PDF and ePub downloads, according to the available data) and Abstracts Views on Vision4Press platform.
Data correspond to usage on the plateform after 2015. The current usage metrics is available 48-96 hours after online publication and is updated daily on week days.
Initial download of the metrics may take a while.