| Issue |
A&A
Volume 706, February 2026
|
|
|---|---|---|
| Article Number | L8 | |
| Number of page(s) | 5 | |
| Section | Letters to the Editor | |
| DOI | https://doi.org/10.1051/0004-6361/202558482 | |
| Published online | 30 January 2026 | |
Letter to the Editor
Discovery of a soft X-ray lag in the tidal disruption event AT2021ehb
National Astronomical Observatories, Chinese Academy of Sciences Beijing 100101, China
★ Corresponding author: This email address is being protected from spambots. You need JavaScript enabled to view it.
Received:
9
December
2025
Accepted:
14
January
2026
Abstract
In this Letter, we report the detection of soft X-ray time lags – i.e., variability in the softer photons lagging behind that in the harder photons – in seven XMM–Newton observations of the tidal disruption event (TDE) candidate AT2021ehb. We find correlated variability between the soft (0.3–0.7 keV) and hard (0.9–10 keV) bands on ∼104 s timescales, and measure a soft lag of ∼500 s. This behavior is broadly consistent with the disk–corona reverberation scenario established in active galactic nuclei (AGNs). Together with the previously reported strong hard X-ray emission and broad Fe K line, our results suggest the presence of a compact corona and prominent relativistic disk reflection in AT2021ehb. The unusually high blackbody temperature (peaking at ∼200 eV) is difficult to reconcile with thermal emission from a standard accretion disk around a ∼107 M⊙ black hole, and may instead be analogous to the soft excess commonly observed in AGNs, whose physical origin remains debated. Finally, the measured lags offer a possible explanation for the rapid X-ray flux decline that occurred only three days after the peak, pointing to a scenario in which the corona cools following a sudden loss of the magnetic support required to sustain it.
Key words: galaxies: active / galaxies: nuclei
© The Authors 2026
 Open Access article, published by EDP Sciences, under the terms of the Creative Commons Attribution License (https://creativecommons.org/licenses/by/4.0), which permits unrestricted use, distribution, and reproduction in any medium, provided the original work is properly cited.
This article is published in open access under the Subscribe to Open model. This email address is being protected from spambots. You need JavaScript enabled to view it. to support open access publication.
1. Introduction
Rapid X-ray variability is often observed in active galactic nuclei (AGNs) and is generally understood to originate in the immediate vicinity of the central supermassive black hole (SMBH; Lynden-Bell 1969; McHardy et al. 2006; Kara & García 2025), thereby providing a powerful probe of the physical conditions and geometry of the innermost accretion flow. One particularly powerful application is X-ray reverberation mapping, which probes the disk–corona geometry through light-travel delays between the coronal continuum and the reprocessed emission. These X-ray lags trace regions within only a few gravitational radii, offering rare access to explore the structure of the immediate vicinity of the central black holes, and providing critical confirmation of the relativistic reflection model (Fabian et al. 2009; Fabian & Ross 2010; Zoghbi et al. 2010; Kara et al. 2013a,b,c; Uttley et al. 2014; Kara et al. 2016a). Within this framework, the disk reflection naturally gives rise to the soft excess observed in many AGNs, through either blended low-ionization line emission or a bremsstrahlung-like continuum. This mechanism also provides a unified explanation for the short soft X-ray lags commonly associated with the soft excess. Nonetheless, this interpretation faces challenges, as fitting the soft excess often pushes reflection models toward extreme and potentially biased parameter regimes, suggesting that another mechanism – a warm corona that comptonizes the UV photons from the inner accretion disk to soft X-rays (Czerny & Elvis 1987; Jin et al. 2009; Middleton et al. 2009; Done et al. 2012) – may also jointly contribute to producing the observed soft excess (Ballantyne 2020; Xiang et al. 2022; Ballantyne et al. 2024). However, because AGNs are observed only in their already-developed states, the origin of the soft excess and the formation of the disk–corona structure remain difficult to constrain.
Transient accretion systems can form when a star passes sufficiently close to a SMBH and is torn apart once the tidal forces exceed its self-gravity, theoretically producing a sudden, significant X-ray brightening accompanied by an unusually soft, thermal X-ray spectrum (Rees 1988). Recent work suggests that, when sufficient magnetic flux is advected inward with the returning stellar debris, a new X-ray–emitting corona can form in TDEs (Begelman & Armitage 2014; Xu et al. 2025). Observational evidence further supports this picture: several events have exhibited late-time hard X-ray emission (> 2 keV) indicative of corona formation, enabled by the growing TDE sample and extensive X-ray follow-up campaigns across multiple observatories (Komossa et al. 2004; Kara et al. 2018; Jonker et al. 2020; Wevers et al. 2021; Yao et al. 2022; Guolo et al. 2024; Yao et al. 2024). Furthermore, analyses of soft and hard X-ray variability in TDEs have recently begun, though to date soft X-ray lags have been reported in only two cases: Swift J1644+57 (Kara et al. 2016b) and AT2018fyk (Zhang 2022). The former is a jetted TDE (Bloom et al. 2011; Levan et al. 2011; Zauderer et al. 2011), and the detection of a soft lag indicates reverberation arising from deep within the relativistic potential, demonstrating that the X-rays do not originate from the relativistically moving regions of a jet (Kara et al. 2016b). The latter underwent a transition from a disk-dominated to a corona-dominated state (Wevers et al. 2019, 2021), and the soft lags observed during its hard state are difficult to reconcile with the reverberation scenario typically invoked for AGNs. Instead, they are consistent with a picture in which the soft X-rays are produced by down-scattering of hard X-rays in an outflow (Zhang 2022).
AT2021ehb is a nearby TDE that exhibits unusually complex X-ray evolution over its first 430 days (Yao et al. 2022). The host galaxy analysis indicates a central black hole mass of MBH ∼ 107 M⊙, whereas X-ray spectral modeling by Xiang et al. (2024) yields a much lower estimate of ∼105.5 M⊙. The event shows a delayed rise in X-ray luminosity, followed by a gradual transition from a soft, thermal spectrum to a hard, nonthermal one, and eventually a rapid return to a soft state accompanied by an order-of-magnitude flux drop. Joint NICER and NuSTAR observations reveal strong hard X-ray emission up to 30 keV and an extremely broad Fe K emission line, pointing to a compact corona and pronounced relativistic disk reflection. Despite these dramatic X-ray changes, the UV–optical emission remains comparatively steady and no radio emission is detected, suggesting a highly aspherical configuration without a relativistic jet (Dai et al. 2018; Alexander et al. 2020; Yao et al. 2022). Yao et al. (2022) interpret the evolving X-ray properties as evidence of the gradual formation of a corona, anisotropic escape of hard X-rays, and a late-time disk instability that may temporarily modify the inner accretion flow geometry. In this Letter, we analyze the XMM-Newton data obtained after the sudden flux drop and perform a timing study to investigate the origin of the soft X-ray emission in AT2021ehb. Using the measured lags, we further provide a plausible explanation for the abrupt decline in X-ray flux. In Section 2, we describe the observations and data reduction. Section 3 presents our X-ray timing and spectral analyses, and in Section 4 we discuss and summarize the implications of our results.
2. Observations and data reductions
We obtained the long-term X-ray light curve and the evolution of the spectral parameters of AT2021ehb directly from the measurements reported in Yao et al. (2022). The light curve is primarily based on Swift/XRT observations, with additional NICER data incorporated to fill gaps in the XRT coverage (Fig. A.1).
AT2021ehb was observed by XMM-Newton at ten epochs. The first observation was largely affected by a high particle background, and the last two observations yielded only marginal detections with insufficient photons for timing analysis. Therefore, we focus on the remaining seven observations, which were obtained between January 25, 2022, and February 6, 2022, with a cadence of approximately two days. We primarily used the data from the EPIC-PN (pn) camera, which has a much higher sensitivity. The data were processed with the Science Analysis Software (SAS) version 17.0.0 using the latest calibration files. Event files were extracted from circular regions with radii of 35″ centered on the source position determined from optical observations (RA = 03:07:47.82, Dec = +40:18:40.85; Yao et al. 2022). Background events were taken from four nearby source-free circular regions with radii of 35″. Photon pile-up was checked using the epatplot command and was found to be negligible. The epochs of high-background events were examined using the light curves in the energy band 10–12 keV. We adopted a count-rate filtering criterion of 0.6 counts s−1 to remove time intervals affected by high particle background. We extracted the source spectra in the 0.3–10 keV range. For the timing analysis, we generated background-subtracted light curves in different energy bands, using identical start and end times, with the SAS task EPICLCCORR and a time bin size of 10 s. Only good events with PATTERN ≤ 4 were used to generate the spectra and light curves.
3. Results
A particularly striking feature visible in the Fig. A.1 panel is the rapid drop in X-ray luminosity (gray-shaded region), during which the flux declines by nearly an order of magnitude in only ∼3 days. All seven XMM-Newton observations analyzed in this work were obtained after this rapid decline, each providing more than 18 ks of clean exposure and thereby enabling a detailed timing analysis. Benefiting from the fact that the seven XMM-Newton observations were obtained over a short time span, we treated the first 18 ks of each observation as an individual segment. By processing seven segments in an identical manner and then averaging the resulting products, we obtained the coherence, frequency–lag spectra, energy–lag spectra, and covariance spectra with a significantly improved statistical confidence. All of the timing-analysis results presented in this work were therefore derived from the combined signal of the seven stacked segments. Each individual observation shows features consistent with those seen in the stacked analysis, but with substantially lower signal-to-noise.
3.1. Time-lag analysis
The coherence between two light curves quantifies the degree to which their variability is correlated, or equivalently how well the variations in one band can predict those in the other. A coherence value of 1 corresponds to perfectly coherent signals (Vaughan & Nowak 1997; Nowak et al. 1999; Vaughan et al. 2003; Uttley et al. 2014). Fig. 1 (bottom panel) shows the coherence between the 0.3–0.7 keV (soft) and 0.9–10.0 keV (hard) bands. For each segment, we computed the Fourier transform and evaluated the coherence and its uncertainty following Vaughan & Nowak (1997) and Zoghbi et al. (2010). The frequency bins were constructed so that the bin size is equal to 1.6 times the frequency value. As is shown in Fig. 1, the two bands remain highly coherent (≥0.8) up to ∼3 × 10⁻⁴ Hz. At higher frequencies, the coherence drops rapidly as Poisson noise begins to dominate.
Fig. 1 (top panel) shows the time lag between the 0.3–0.7 keV and 0.9–10.0 keV bands as a function of Fourier frequency. The lags were computed following the method described in (Nowak et al. 1999; Zoghbi et al. 2010; Uttley et al. 2014), and we adopt the convention that a negative lag indicates that the soft-band variations follow those in the hard band. Between 8 × 10⁻⁵ and 2 × 10⁻⁴ Hz, the lags are negative, indicating that the hard-band variations lead. At frequencies below 8 × 10⁻⁵ Hz, the lags are consistent with zero, although with relatively large uncertainties, and the finite duration of the observations prevents us from constraining the lag behavior at even lower frequencies. Consistent with the coherence results, the lag approaches zero at frequencies of ≳4 × 10⁻⁴ Hz, where the signal becomes dominated by Poisson noise.
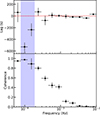 |
Fig. 1. Top panel: Soft (0.3–0.7 keV) versus hard (0.9–10 keV) lags as a function of temporal frequency. By convention, negative lags correspond to the soft band lagging behind the hard band. Variability on timescales of 104 s shows a soft lag of approximately 500 s. Bottom panel: Coherence as a function of frequency between the 0.3–0.7 and 0.9–10 keV bands. The blue-shaded region highlights the frequency range in which the soft band lags the hard band, during which the coherence remains close to 1. The blue-shaded frequency range was used to construct the energy–lag spectrum and the covariance spectrum. All statistical errors correspond to the 90% confidence level. |
We also examined how the time lag varies as a function of energy within the frequency range 8 × 10⁻⁵–2 × 10⁻⁴ Hz, where the hard-band variations lead those in the soft band. Based on the available photon statistics, we defined a set of logarithmically spaced energy bins. For each bin, the lag was computed between the light curve in that bin and a broad 0.3–10 keV reference band. In constructing the reference band, the channel corresponding to the bin of interest was removed to ensure that the Poisson noise remained uncorrelated (Uttley et al. 2014). In this case, a negative lag indicates that variability in the given energy bin leads the reference band, whereas a positive lag indicates that it lags behind. The energy–lag spectrum obtained by stacking the seven observations is shown in Fig. 2.
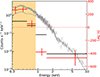 |
Fig. 2. Energy-dependent variability functions. The red points show the energy–lag spectrum, and the black points show the covariance spectrum. The gray points represent the time-averaged pn spectrum, while the best-fitting model with the diskbb component removed is shown as a gray curve. The orange-shaded region marks the energies at which the soft band lags the reference band, corresponding closely to the energy range where the diskbb component contributes significantly in the time-averaged spectrum. All statistical errors correspond to the 90% confidence level. |
3.2. Energy and covariance spectrum
We fit the highest–signal-to-noise pn spectrum using XSPEC 12.14.0. The data were rebinned with GRPPHA to ensure a minimum of 25 counts per bin, and the model was fit using χ2 statistics. The pn spectrum is modeled with wabs*zwabs*(diskbb + zpowerlaw), consisting of a thermal disk–blackbody component and a nonthermal power-law component. Both components are subject to Galactic absorption as well as intrinsic absorption from the source. The best-fit model yields χ2/dof = 347/342 ≃ 1.0. The photon index is Γ = 2.67 ± 0.09, and the disk temperature is kT = 0.14 ± 0.01 keV (Fig. 2).
To investigate the origin of the correlated variability, we computed the covariance spectrum in the frequency range 8 × 10⁻⁵–2 × 10⁻⁴ Hz. The covariance and its uncertainties were calculated following the method of Wilkinson & Uttley (2009) and Uttley et al. (2014), using the same energy bins and reference band adopted for the energy–lag analysis. The resulting covariance spectrum can be described by a power law with a photon index of ∼2.0, which is flatter than the best-fitting photon index of the time-averaged spectrum. This shape indicates that the correlated variability is more strongly associated with the nonthermal emission component than with the thermal emission (Fig. 2).
4. Discussion and conclusion
As is shown in Fig. A.1 (panel b), the X-ray blackbody temperature of AT2021ehb rises from ∼70 eV to nearly ∼200 eV as the X-ray luminosity approaches its peak. Such high temperatures pose a challenge to the commonly adopted interpretation that the soft X-ray emission in TDEs originates from the inner regions of a standard accretion disk (Saxton et al. 2020), since for a black hole of mass ∼107 M⊙ even maximal spin cannot produce effective disk temperatures near ∼200 eV (Yao et al. 2022). However, temperatures of this order are consistent with those typically inferred for the soft X-ray excess in AGN (Gierliński & Done 2004; Crummy et al. 2006; Jin et al. 2012; Done et al. 2012). Yao et al. (2022) propose that this apparent discrepancy can be resolved if the observed color temperature is significantly boosted above the effective disk temperature due to comptonization, such that a large color-correction factor (fc) raises the apparent inner-disk temperature, Tin, well beyond the maximum temperature predicted for a thin disk.
Our timing analysis indicates that disk–corona reprocessing likely plays a significant role in producing the soft excess in AT2021ehb. In AGNs, soft-band lags are widely interpreted as signatures of coronal hard X-ray photons irradiating the inner accretion disk and being reprocessed into lower-energy emission. The resulting reflection spectrum can generate the observed soft excess, either through blended low-ionization line emission or a bremsstrahlung-like continuum arising from free–free processes, and naturally introduces a light-travel delay between the hard and soft bands. In a TDE, the returning stellar debris rapidly circularizes and forms a geometrically thin accretion disk, where the magnetorotational instability generates turbulence that dissipates gravitational energy (Xu et al. 2025). A fraction of this dissipated energy is transported vertically by buoyant magnetic fields into an optically thin, hot coronal layer above the disk. Magnetic reconnection in this region heats the electrons to high temperatures, producing a comptonizing plasma (Xu et al. 2025). The correspondence between our observed soft lag and this well-established reverberation behavior suggests that the soft excess in AT2021ehb may originate from the same disk–corona interaction. In this context, the measured soft lag of ∼500 s implies a light-travel distance of roughly 10 gravitational radii for a black hole mass of 107 M⊙.
De Marco et al. (2013) conducted a systematic study of X-ray reverberation lags in AGNs and showed that both the characteristic lag frequency and lag amplitude scale with the SMBH mass. For a black hole mass of 107 M⊙, their relations predict a reverberation frequency of ∼3 × 10⁻⁴ Hz and a lag amplitude of ∼100 s. Both values are somewhat offset from the observationally inferred ranges for AT2021ehb; that is, νlag ∼ 8 × 10⁻⁵ − 2 × 10⁻⁴ Hz and τ ∼ 500 s. Similar deviations were also reported in AT2018fyk and were interpreted as arising from reprocessing in an outflow (Zhang 2022). However, unlike AT2018fyk – which shows no soft excess in the covariance spectrum – AT2021ehb exhibits a clear soft excess component, indicating that the soft emission participates coherently in the correlated variability and is more consistent with a disk-reverberation origin (Uttley et al. 2011). Such deviations have been reported in various AGNs and are often attributed to changes in the disk–corona geometry, frequently accompanied by flux-state transitions, including variations in the coronal height, size, or illumination pattern (Kara et al. 2013a; Alston et al. 2014; Uttley et al. 2014). A plausible explanation for this discrepancy in AT2021ehb is an abrupt reduction in the magnetic power feeding the corona, such that when the magnetic energy injection weakens, the innermost coronal plasma is rapidly cooled by soft disk photons, causing the hard-X-ray–emitting region to appear more distant from the disk in terms of its illumination on short timescales. Such a geometric reconfiguration naturally produces a sudden drop in the observed X-ray luminosity, accompanied by a sharp increase in the spectral photon index and a marked decrease in the fraction of seed photons scattered into the corona (fsc), consistent with the parameter changes observed during the ∼3-day decline of AT2021ehb after its peak (Fig. A.1). Unfortunately, no XMM-Newton observations were available during the peak-flux epoch of AT2021ehb, preventing a direct test of this sudden change in the disk–corona geometry. Similar time-dependent geometric transitions have so far only been clearly detected in X-ray binaries (Kara et al. 2019; You et al. 2021), but future improvements in observational capabilities may enable their identification in SMBH systems as well.
Acknowledgments
This research made use of the HEASARC online data archive services, supported by NASA/GSFC, and is based on observations obtained with XMM-Newton. The author would like to thank Xinwen Shu, Chichuan Jin and Mingjun Liu for helpful discussions. This work is supported by the National Natural Science Foundation of China (grant no. 12433005, 12333004).
References
- Alexander, K. D., van Velzen, S., Horesh, A., & Zauderer, B. A. 2020, Space Sci. Rev., 216, 81 [CrossRef] [Google Scholar]
- Alston, W. N., Done, C., & Vaughan, S. 2014, MNRAS, 439, 1548 [NASA ADS] [CrossRef] [Google Scholar]
- Ballantyne, D. R. 2020, MNRAS, 491, 3553 [NASA ADS] [CrossRef] [Google Scholar]
- Ballantyne, D. R., Sudhakar, V., Fairfax, D., et al. 2024, MNRAS, 530, 1603 [NASA ADS] [CrossRef] [Google Scholar]
- Begelman, M. C., & Armitage, P. J. 2014, ApJ, 782, L18 [NASA ADS] [CrossRef] [Google Scholar]
- Bloom, J. S., Giannios, D., Metzger, B. D., et al. 2011, Science, 333, 203 [CrossRef] [PubMed] [Google Scholar]
- Crummy, J., Fabian, A. C., Gallo, L., & Ross, R. R. 2006, MNRAS, 365, 1067 [Google Scholar]
- Czerny, B., & Elvis, M. 1987, ApJ, 321, 305 [NASA ADS] [CrossRef] [Google Scholar]
- Dai, L., McKinney, J. C., Roth, N., Ramirez-Ruiz, E., & Miller, M. C. 2018, ApJ, 859, L20 [Google Scholar]
- De Marco, B., Ponti, G., Cappi, M., et al. 2013, MNRAS, 431, 2441 [Google Scholar]
- Done, C., Davis, S. W., Jin, C., Blaes, O., & Ward, M. 2012, MNRAS, 420, 1848 [Google Scholar]
- Fabian, A. C., & Ross, R. R. 2010, Space Sci. Rev., 157, 167 [NASA ADS] [CrossRef] [Google Scholar]
- Fabian, A. C., Zoghbi, A., Ross, R. R., et al. 2009, Nature, 459, 540 [Google Scholar]
- Gierliński, M., & Done, C. 2004, MNRAS, 349, L7 [Google Scholar]
- Guolo, M., Gezari, S., Yao, Y., et al. 2024, ApJ, 966, 160 [NASA ADS] [CrossRef] [Google Scholar]
- Jin, C., Done, C., Ward, M., Gierliński, M., & Mullaney, J. 2009, MNRAS, 398, L16 [NASA ADS] [CrossRef] [Google Scholar]
- Jin, C., Ward, M., Done, C., & Gelbord, J. 2012, MNRAS, 420, 1825 [Google Scholar]
- Jonker, P. G., Stone, N. C., Generozov, A., van Velzen, S., & Metzger, B. 2020, ApJ, 889, 166 [NASA ADS] [CrossRef] [Google Scholar]
- Kara, E., & García, J. 2025, ARA&A, 63, 379 [Google Scholar]
- Kara, E., Fabian, A. C., Cackett, E. M., Miniutti, G., & Uttley, P. 2013a, MNRAS, 430, 1408 [NASA ADS] [CrossRef] [Google Scholar]
- Kara, E., Fabian, A. C., Cackett, E. M., et al. 2013b, MNRAS, 428, 2795 [NASA ADS] [CrossRef] [Google Scholar]
- Kara, E., Fabian, A. C., Cackett, E. M., et al. 2013c, MNRAS, 434, 1129 [NASA ADS] [CrossRef] [Google Scholar]
- Kara, E., Alston, W. N., Fabian, A. C., et al. 2016a, MNRAS, 462, 511 [NASA ADS] [CrossRef] [Google Scholar]
- Kara, E., Miller, J. M., Reynolds, C., & Dai, L. 2016b, Nature, 535, 388 [NASA ADS] [CrossRef] [Google Scholar]
- Kara, E., Dai, L., Reynolds, C. S., & Kallman, T. 2018, MNRAS, 474, 3593 [Google Scholar]
- Kara, E., Steiner, J. F., Fabian, A. C., et al. 2019, Nature, 565, 198 [Google Scholar]
- Komossa, S., Halpern, J., Schartel, N., et al. 2004, ApJ, 603, L17 [NASA ADS] [CrossRef] [Google Scholar]
- Levan, A. J., Tanvir, N. R., Cenko, S. B., et al. 2011, Science, 333, 199 [NASA ADS] [CrossRef] [Google Scholar]
- Lynden-Bell, D. 1969, Nature, 223, 690 [NASA ADS] [CrossRef] [Google Scholar]
- McHardy, I. M., Koerding, E., Knigge, C., Uttley, P., & Fender, R. P. 2006, Nature, 444, 730 [NASA ADS] [CrossRef] [Google Scholar]
- Middleton, M., Done, C., Ward, M., Gierliński, M., & Schurch, N. 2009, MNRAS, 394, 250 [CrossRef] [Google Scholar]
- Nowak, M. A., Vaughan, B. A., Wilms, J., Dove, J. B., & Begelman, M. C. 1999, ApJ, 510, 874 [NASA ADS] [CrossRef] [Google Scholar]
- Rees, M. J. 1988, Nature, 333, 523 [Google Scholar]
- Saxton, R., Komossa, S., Auchettl, K., & Jonker, P. G. 2020, Space Sci. Rev., 216, 85 [NASA ADS] [CrossRef] [Google Scholar]
- Uttley, P., Wilkinson, T., Cassatella, P., et al. 2011, MNRAS, 414, L60 [NASA ADS] [Google Scholar]
- Uttley, P., Cackett, E. M., Fabian, A. C., Kara, E., & Wilkins, D. R. 2014, A&ARv, 22, 72 [NASA ADS] [CrossRef] [Google Scholar]
- Vaughan, B. A., & Nowak, M. A. 1997, ApJ, 474, L43 [CrossRef] [Google Scholar]
- Vaughan, S., Fabian, A. C., & Nandra, K. 2003, MNRAS, 339, 1237 [NASA ADS] [CrossRef] [Google Scholar]
- Wevers, T., Pasham, D. R., van Velzen, S., et al. 2019, MNRAS, 488, 4816 [Google Scholar]
- Wevers, T., Pasham, D. R., van Velzen, S., et al. 2021, ApJ, 912, 151 [NASA ADS] [CrossRef] [Google Scholar]
- Wilkinson, T., & Uttley, P. 2009, MNRAS, 397, 666 [NASA ADS] [CrossRef] [Google Scholar]
- Xiang, X., Ballantyne, D. R., Bianchi, S., et al. 2022, MNRAS, 515, 353 [NASA ADS] [CrossRef] [Google Scholar]
- Xiang, X., Miller, J. M., Zoghbi, A., et al. 2024, ApJ, 972, 106 [Google Scholar]
- Xu, H., Cao, X., Wang, Y., & Zdziarski, A. A. 2025, MNRAS, 544, 1748 [Google Scholar]
- Yao, Y., Lu, W., Guolo, M., et al. 2022, ApJ, 937, 8 [NASA ADS] [CrossRef] [Google Scholar]
- Yao, Y., Guolo, M., Tombesi, F., et al. 2024, ApJ, 976, 34 [Google Scholar]
- You, B., Tuo, Y., Li, C., et al. 2021, Nat. Commun., 12, 1025 [NASA ADS] [CrossRef] [Google Scholar]
- Zauderer, B. A., Berger, E., Soderberg, A. M., et al. 2011, Nature, 476, 425 [NASA ADS] [CrossRef] [Google Scholar]
- Zhang, W. 2022, MNRAS, 511, 19 [Google Scholar]
- Zoghbi, A., Fabian, A. C., Uttley, P., et al. 2010, MNRAS, 401, 2419 [Google Scholar]
Appendix A: Evolution of the X-ray light curve and best-fit spectral parameters of AT2021ehb
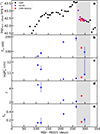 |
Fig. A.1. Panel a: X-ray luminosity of AT2021ehb in the 0.3–10 keV band. Panels b–e show the evolution of the spectral parameters, where Tin denotes the inner-disk temperature and |


All Figures
|
Fig. 1. Top panel: Soft (0.3–0.7 keV) versus hard (0.9–10 keV) lags as a function of temporal frequency. By convention, negative lags correspond to the soft band lagging behind the hard band. Variability on timescales of 104 s shows a soft lag of approximately 500 s. Bottom panel: Coherence as a function of frequency between the 0.3–0.7 and 0.9–10 keV bands. The blue-shaded region highlights the frequency range in which the soft band lags the hard band, during which the coherence remains close to 1. The blue-shaded frequency range was used to construct the energy–lag spectrum and the covariance spectrum. All statistical errors correspond to the 90% confidence level. |
| In the text | |
|
Fig. 2. Energy-dependent variability functions. The red points show the energy–lag spectrum, and the black points show the covariance spectrum. The gray points represent the time-averaged pn spectrum, while the best-fitting model with the diskbb component removed is shown as a gray curve. The orange-shaded region marks the energies at which the soft band lags the reference band, corresponding closely to the energy range where the diskbb component contributes significantly in the time-averaged spectrum. All statistical errors correspond to the 90% confidence level. |
| In the text | |
|
Fig. A.1. Panel a: X-ray luminosity of AT2021ehb in the 0.3–10 keV band. Panels b–e show the evolution of the spectral parameters, where Tin denotes the inner-disk temperature and |
| In the text | |
Current usage metrics show cumulative count of Article Views (full-text article views including HTML views, PDF and ePub downloads, according to the available data) and Abstracts Views on Vision4Press platform.
Data correspond to usage on the plateform after 2015. The current usage metrics is available 48-96 hours after online publication and is updated daily on week days.
Initial download of the metrics may take a while.