Fig. 2.
Download original image
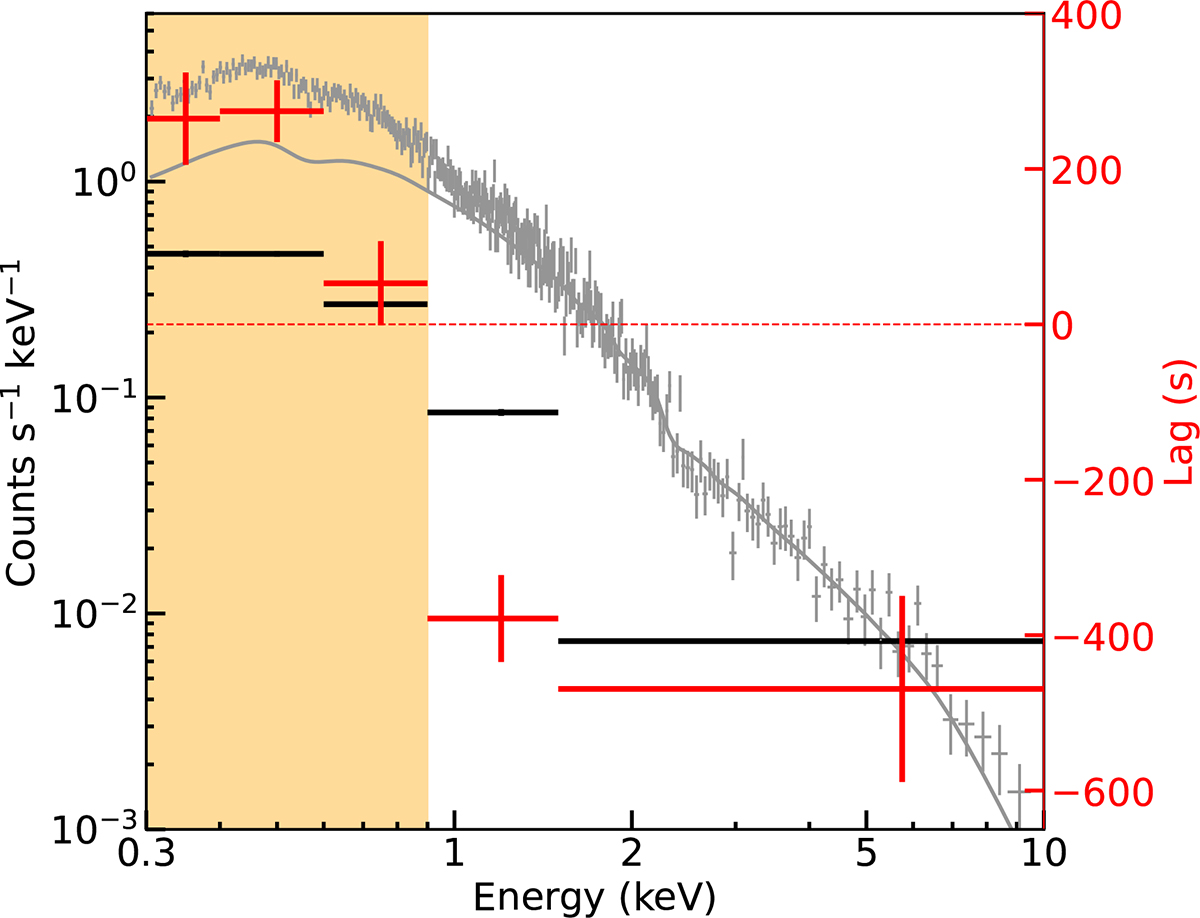
Energy-dependent variability functions. The red points show the energy–lag spectrum, and the black points show the covariance spectrum. The gray points represent the time-averaged pn spectrum, while the best-fitting model with the diskbb component removed is shown as a gray curve. The orange-shaded region marks the energies at which the soft band lags the reference band, corresponding closely to the energy range where the diskbb component contributes significantly in the time-averaged spectrum. All statistical errors correspond to the 90% confidence level.
Current usage metrics show cumulative count of Article Views (full-text article views including HTML views, PDF and ePub downloads, according to the available data) and Abstracts Views on Vision4Press platform.
Data correspond to usage on the plateform after 2015. The current usage metrics is available 48-96 hours after online publication and is updated daily on week days.
Initial download of the metrics may take a while.