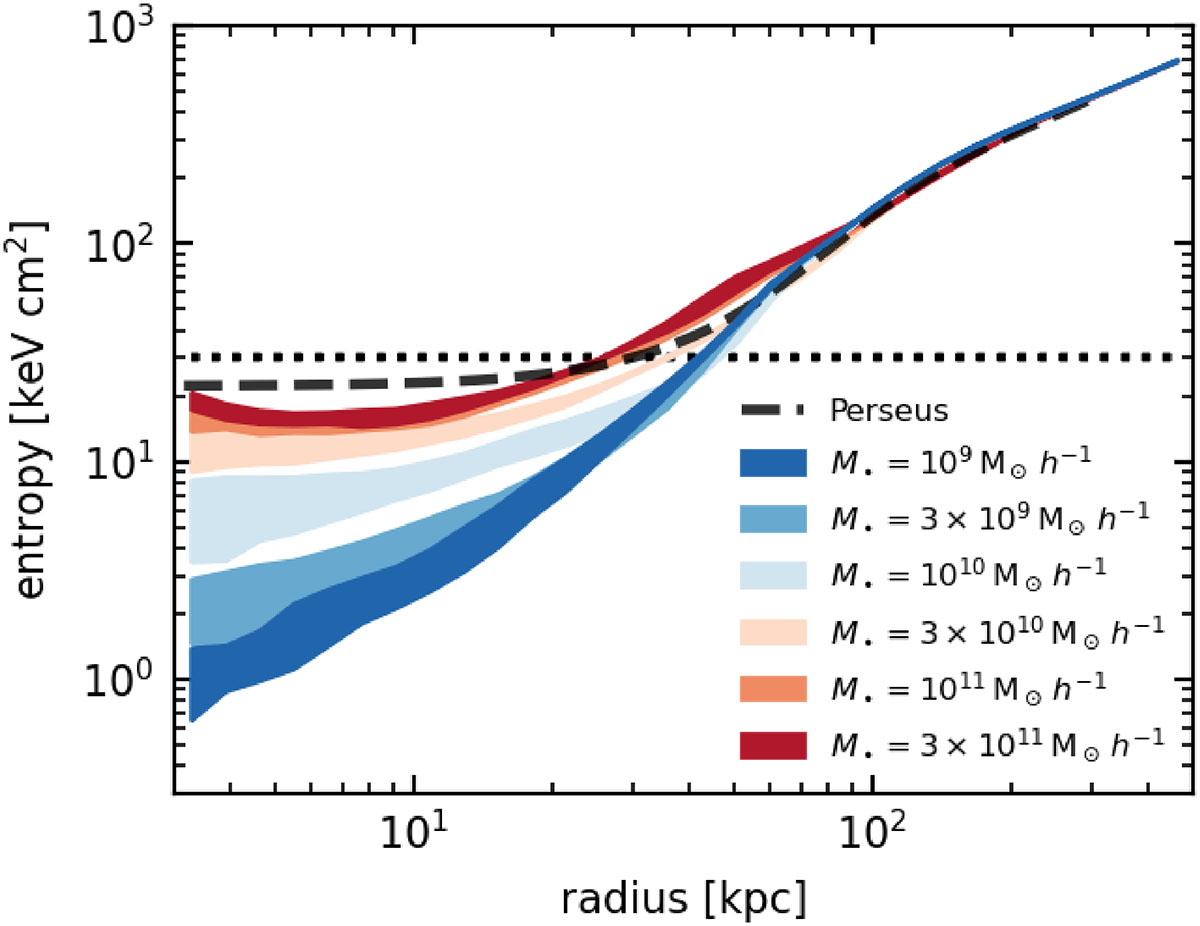
Fig. 1.
Download original image
Entropy profiles of X-ray-emitting gas of Perseus analogue self-regulated simulations with different SMBH masses (see legend). The coloured area indicates the 16th to 84th percentile of snapshots at times between t = 0.55 Gyr and t = 1 Gyr. The dotted line denotes 30 keV cm2, an empirical dividing line between cool-core and non-cool-core clusters. The dashed line denotes the entropy profile of the Perseus cluster from Churazov et al. (2003), rescaled to h = 0.67. The central entropy establishes an equilibrium value that is dependent on SMBH mass.
Current usage metrics show cumulative count of Article Views (full-text article views including HTML views, PDF and ePub downloads, according to the available data) and Abstracts Views on Vision4Press platform.
Data correspond to usage on the plateform after 2015. The current usage metrics is available 48-96 hours after online publication and is updated daily on week days.
Initial download of the metrics may take a while.