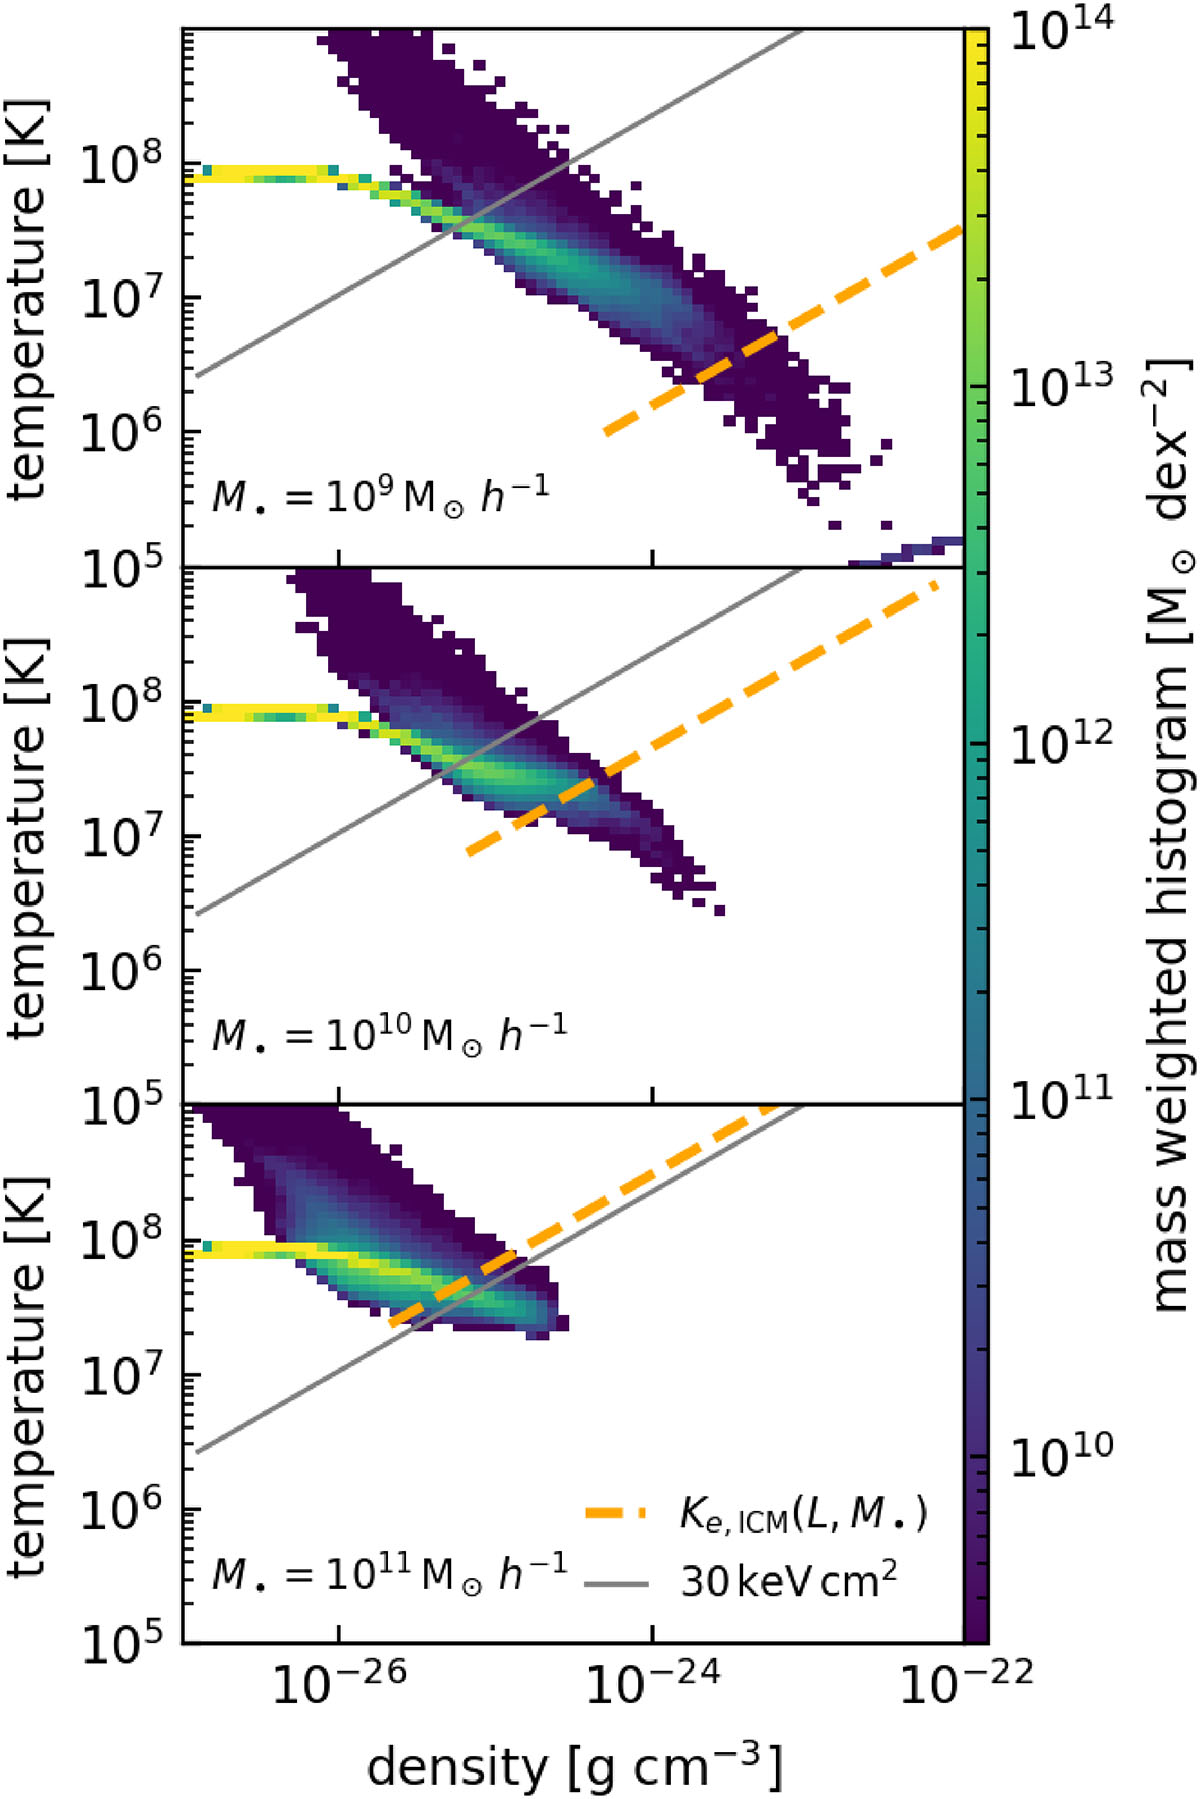
Fig. 2.
Download original image
Temperature vs density phase diagram, colour-coded by mass. The grey line indicates an electron entropy of 30 keV cm2, and the dashed orange line indicates the equilibrium ICM entropy predicted by our model (see text for details). Most of the gas mass is above our equilibrium entropy value, implying that efficient AGN jet feedback sets a SMBH mass-dependent entropy floor in the central ICM.
Current usage metrics show cumulative count of Article Views (full-text article views including HTML views, PDF and ePub downloads, according to the available data) and Abstracts Views on Vision4Press platform.
Data correspond to usage on the plateform after 2015. The current usage metrics is available 48-96 hours after online publication and is updated daily on week days.
Initial download of the metrics may take a while.