| Issue |
A&A
Volume 706, February 2026
|
|
|---|---|---|
| Article Number | C3 | |
| Number of page(s) | 1 | |
| Section | Extragalactic astronomy | |
| DOI | https://doi.org/10.1051/0004-6361/202659153e | |
| Published online | 16 February 2026 | |
RUBIES: A spectroscopic census of little red dots
All point sources with v-shaped continua have broad lines (Corrigendum)
1
Max-Planck-Institut für Astronomie Königstuhl 17 D-69117 Heidelberg, Germany
2
Center for Interdisciplinary Exploration and Research in Astrophysics (CIERA), Northwestern University 1800 Sherman Ave Evanston IL 60201, USA
3
Department of Astrophysical Sciences, Princeton University 4 Ivy Lane Princeton NJ 08544, USA
4
Centre for Astrophysics and Supercomputing, Swinburne University of Technology Melbourne VIC 3122, Australia
5
Cosmic Dawn Center (DAWN) Copenhagen, Denmark
6
Niels Bohr Institute, University of Copenhagen Jagtvej 128 Copenhagen, Denmark
7
Department of Physics and Astronomy and PITT PACC, University of Pittsburgh Pittsburgh PA 15260, USA
8
Leiden Observatory, Leiden University PO Box 9513 NL-2300 RA Leiden, The Netherlands
9
Department of Astronomy & Astrophysics; Institute for Computational & Data Sciences; Institute for Gravitation and the Cosmos; The Pennsylvania State University University Park PA 16802, USA
10
Department of Astronomy, University of Wisconsin-Madison Madison WI 53706, USA
11
Institute of Science and Technology Austria (ISTA) Am Campus 1 3400 Klosterneuburg, Austria
12
MIT Kavli Institute for Astrophysics and Space Research 70 Vassar Street Cambridge MA 02139, USA
13
Department of Astronomy, University of Geneva Chemin Pegasi 51 1290 Versoix, Switzerland
14
Department of Astronomy, University of Massachusetts Amherst MA 01003, USA
15
NSF National Optical-Infrared Astronomy Research Laboratory 950 North Cherry Avenue Tucson AZ 85719, USA
★ Corresponding author: This email address is being protected from spambots. You need JavaScript enabled to view it.
Key words: errata, addenda / galaxies: active / galaxies: high-redshift
Brinson Prize Fellow.
NHFP NASA Hubble Fellow.
We have identified a missing 1 + z factor in the computation of the absolute UV magnitude, MUV, for the RUBIES galaxy, broad Balmer line, and RUBIES LRD samples in the original paper. This shifts the range in the right panel of Figure 8. Although all the sources shift by roughly similar amounts, we note that this does not change any of the conclusions in the original work: at fixed LHα, the LRDs remain faint in the rest-UV compared to the full population. Conversely, extreme Hα emitters (LHα ≳ 1010 M⊙) are dominated by LRDs – that is, the LRDs constitute the most luminous Hα emitters at fixed UV luminosity. This does not affect the associated catalogs, which did not publish MUV.
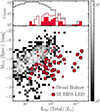 |
Fig. 8. (Right): Corrected absolute UV magnitude (MUV) at 1500 Å, derived from rest-UV spectroscopic slopes and plotted against total (narrow plus broad) Hα luminosity. RUBIES sources with robust zspec > 3.1 are shown as a gray histogram. Broad-line sources are indicated with dark red circles, while LRDs – defined as galaxies with v-shaped continua, broad Balmer lines, and dominant rest-optical point sources – are shown as light red hexagons. |
© The Authors 2026
 Open Access article, published by EDP Sciences, under the terms of the Creative Commons Attribution License (https://creativecommons.org/licenses/by/4.0), which permits unrestricted use, distribution, and reproduction in any medium, provided the original work is properly cited.
This article is published in open access under the Subscribe to Open model.
Open access funding provided by Max Planck Society.
All Figures
|
Fig. 8. (Right): Corrected absolute UV magnitude (MUV) at 1500 Å, derived from rest-UV spectroscopic slopes and plotted against total (narrow plus broad) Hα luminosity. RUBIES sources with robust zspec > 3.1 are shown as a gray histogram. Broad-line sources are indicated with dark red circles, while LRDs – defined as galaxies with v-shaped continua, broad Balmer lines, and dominant rest-optical point sources – are shown as light red hexagons. |
| In the text | |
Current usage metrics show cumulative count of Article Views (full-text article views including HTML views, PDF and ePub downloads, according to the available data) and Abstracts Views on Vision4Press platform.
Data correspond to usage on the plateform after 2015. The current usage metrics is available 48-96 hours after online publication and is updated daily on week days.
Initial download of the metrics may take a while.