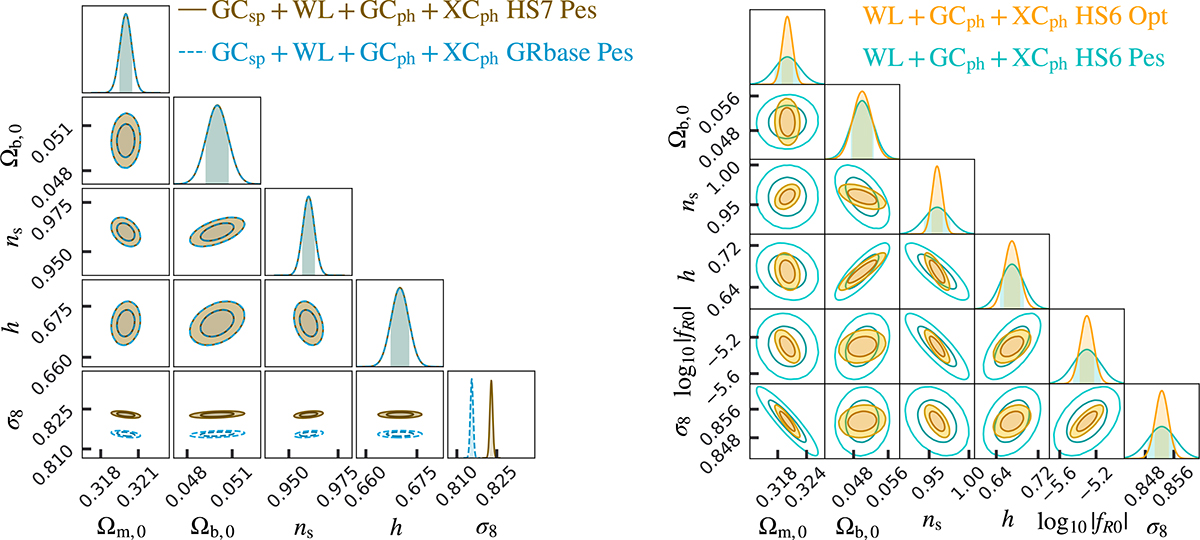
Fig. A.3.
Download original image
Left panel: Comparison of the posterior contours when fixing (i.e. maximising) the log10|fR0| parameter from the Fisher matrices for the full combination GCsp+WL+GCph+XCph for the HS7 case. In dark yellow the HS7 case and in cyan dashed lines the GR baseline case. The contour shapes match very well in all parameter subspaces, considering that in σ8 their fiducial values are different. This is expected from the fact that the HS7 model is very close to ΛCDM. Right panel: Full combination GCsp+WL+GCph+XCph for the HS6 case, comparing the optimistic (yellow, solid) and pessimistic (cyan, empty) specifications. See Table 1 for details on these settings.
Current usage metrics show cumulative count of Article Views (full-text article views including HTML views, PDF and ePub downloads, according to the available data) and Abstracts Views on Vision4Press platform.
Data correspond to usage on the plateform after 2015. The current usage metrics is available 48-96 hours after online publication and is updated daily on week days.
Initial download of the metrics may take a while.