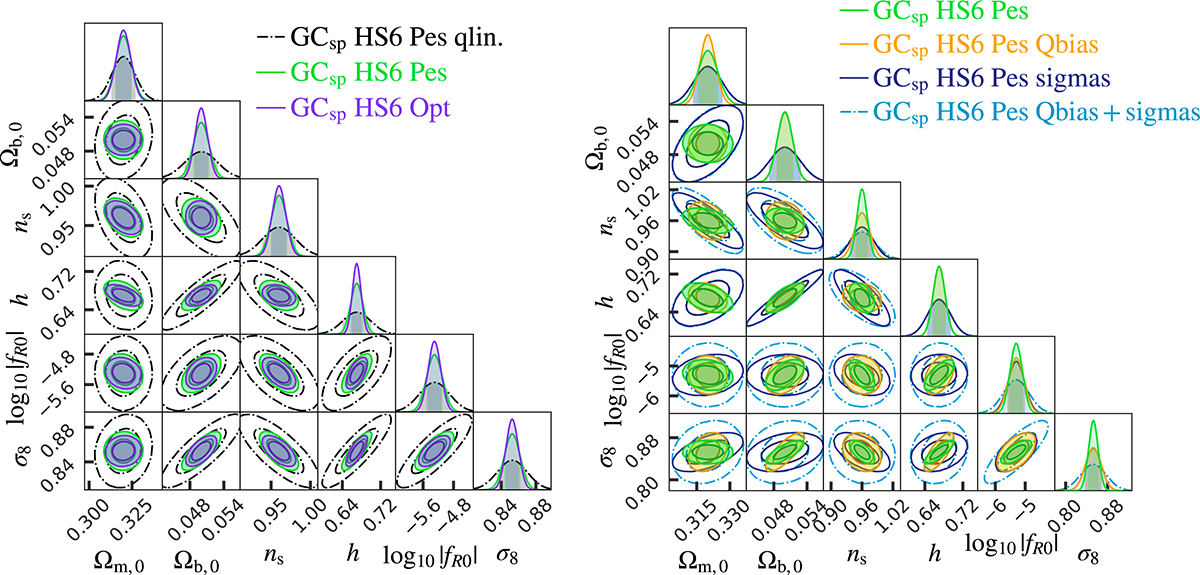
Fig. A.4.
Download original image
Left panel: Joint marginal error contours 1 σ and 2 σ on the cosmological parameters for a flat f(R) model with |fR0| = 5 × 10⁻⁶ (HS6) for the GCsp probe. In black dot-dashed lines the quasi-linear case (kmax = 0.15 h Mpc−1), in solid green the baseline pessimistic case (kmax = 0.25 h Mpc−1) and in purple the optimistic case (kmax = 0.3 h Mpc−1). Right panel: Same as in the left panel but now comparing the pessimistic baseline case (solid green) against the more realistic models, with increasing level of complexity. In yellow the addition of scale-dependent Q-bias, in dark blue the addition of free σp and σv nuisance parameters at each redshift bin and in cyan (dash-dotted line contour) the addition of both terms together for a total of 10 extra nuisance parameters. The loss in constraining power when using this more accurate model is similar to the loss in constraining power when doing a quasi-linear scale cut.
Current usage metrics show cumulative count of Article Views (full-text article views including HTML views, PDF and ePub downloads, according to the available data) and Abstracts Views on Vision4Press platform.
Data correspond to usage on the plateform after 2015. The current usage metrics is available 48-96 hours after online publication and is updated daily on week days.
Initial download of the metrics may take a while.