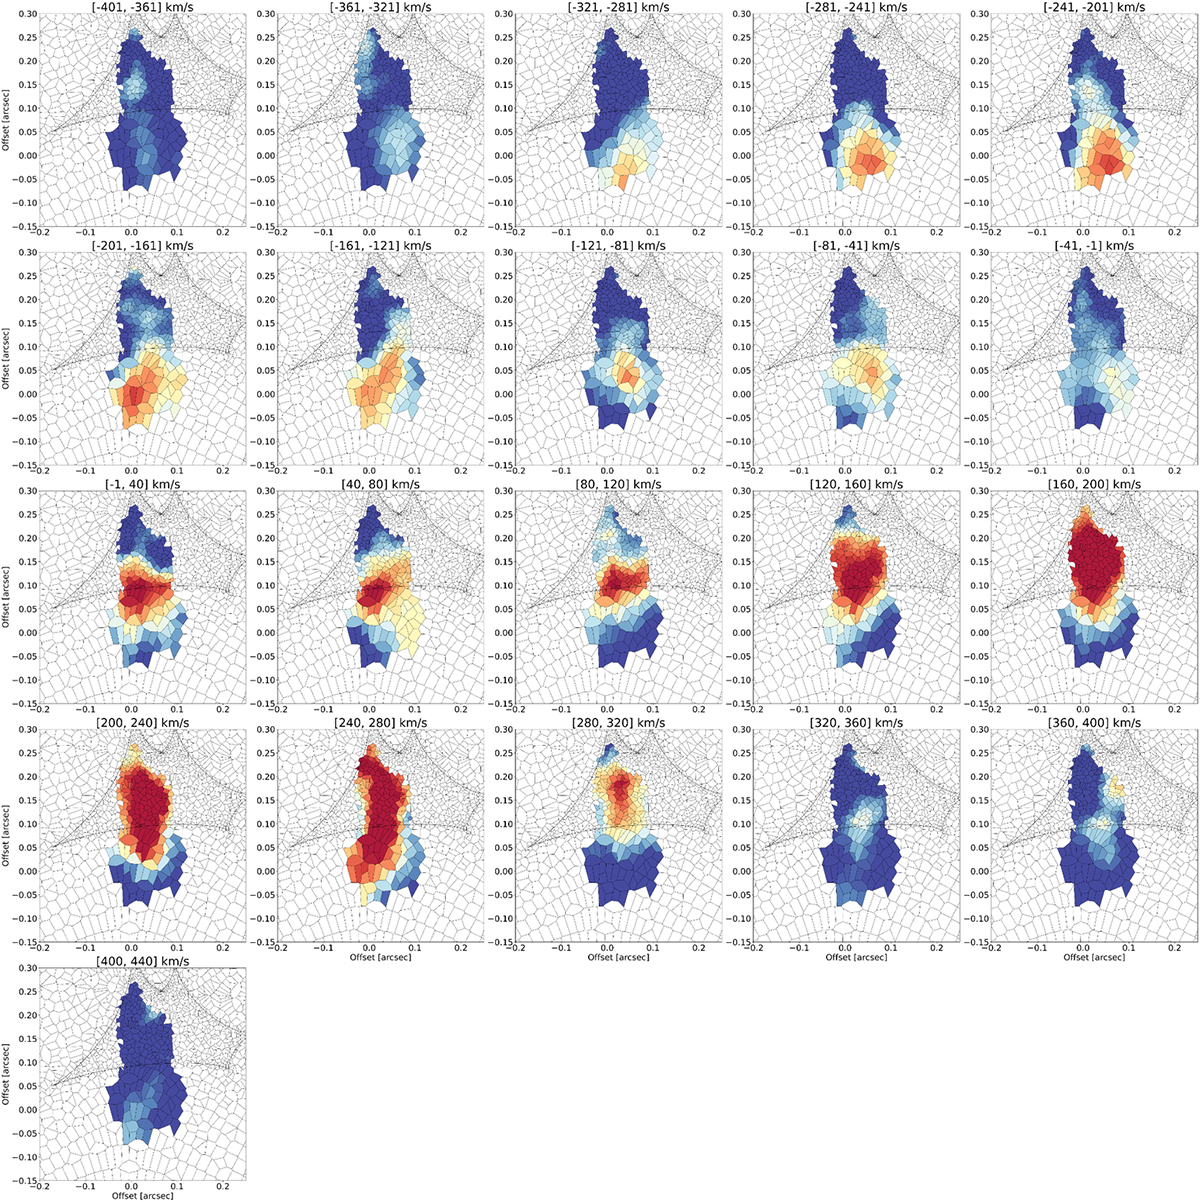
Fig. 10.
Download original image
Source plane channel maps for the CO(6−5) emission from the demagnified source plane emission cube described in Sect. 3.3.3. The velocities covered by each bin are shown at the top of the image. The background mesh shows the Voronoi mesh pixels prior to interpolation to a square grid. Black line shows the caustic line. A clear velocity gradient is evident across the emission line.
Current usage metrics show cumulative count of Article Views (full-text article views including HTML views, PDF and ePub downloads, according to the available data) and Abstracts Views on Vision4Press platform.
Data correspond to usage on the plateform after 2015. The current usage metrics is available 48-96 hours after online publication and is updated daily on week days.
Initial download of the metrics may take a while.