Fig. 11.
Download original image
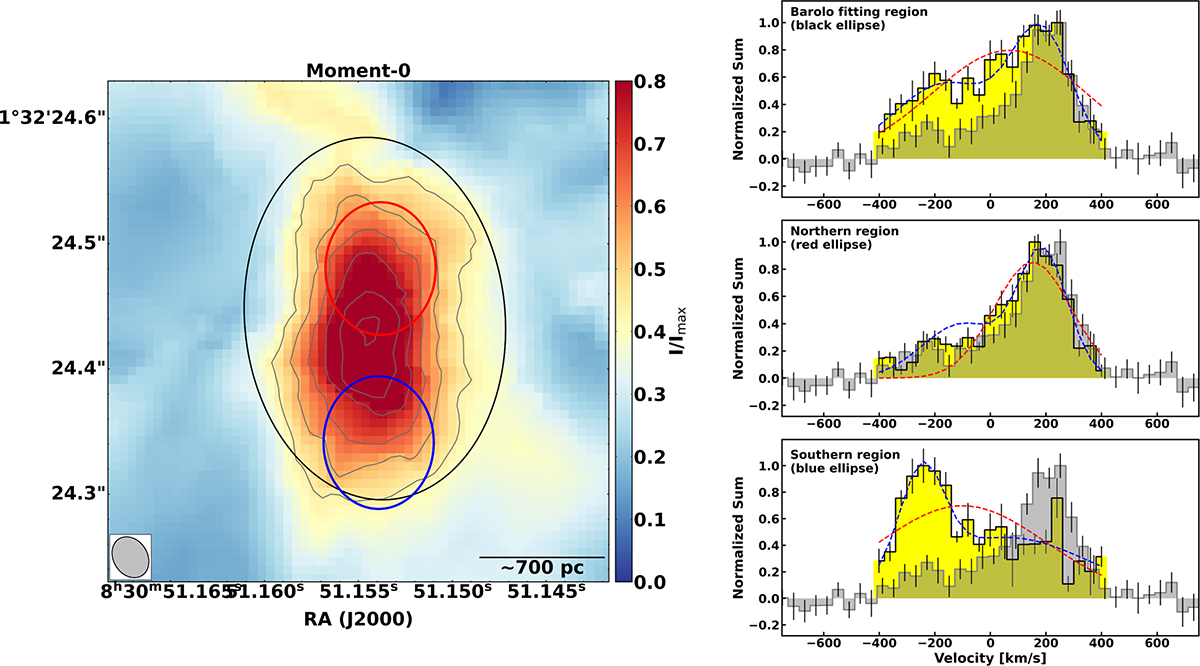
Comparison between the approximate image plane spectrum and source plane spectrum of the CO(6−5) emission in G09v1.97. Left: Source plane moment-0 map of the CO(6−5) emission with the different regions used for the source plane spectral extraction. Right: Normalized source plane spectrum (in yellow) compared to the normalized image plane spectrum (in grey) extracted from the region used in 3DBAROLO modeling (top), a northern region of the source located inside the caustic line (middle), and a southern region of the source located outside the caustic line (bottom). Note: the per-channel values are the normalized sum in a specific region as described in Sect. 4.1.1 and not a standard flux. The error bars are shown for each channel. Single Gaussian profiles are shown in red, while double Gaussian profiles are shown in blue.
Current usage metrics show cumulative count of Article Views (full-text article views including HTML views, PDF and ePub downloads, according to the available data) and Abstracts Views on Vision4Press platform.
Data correspond to usage on the plateform after 2015. The current usage metrics is available 48-96 hours after online publication and is updated daily on week days.
Initial download of the metrics may take a while.