Fig. 12.
Download original image
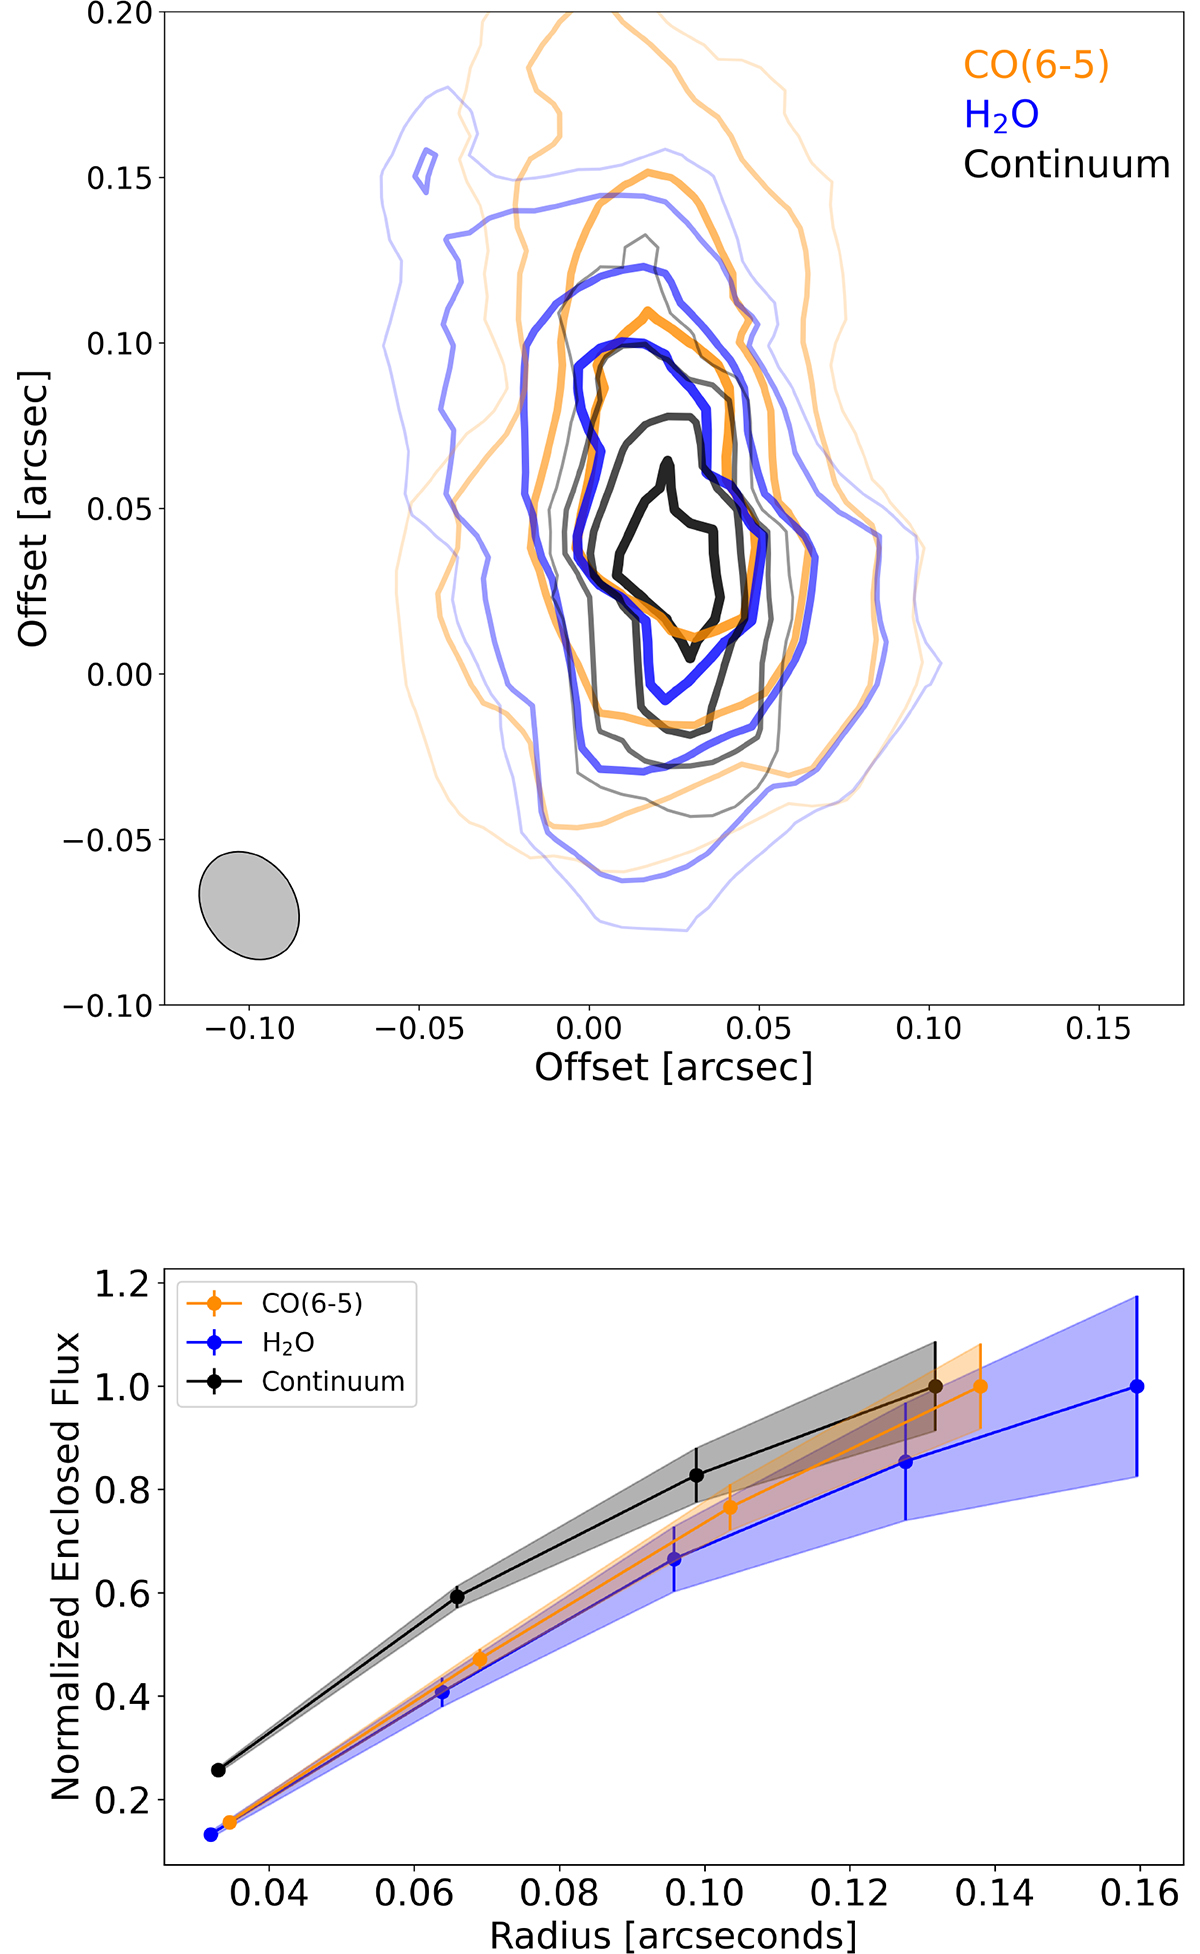
Top: Source plane contour plots of the dust continuum, CO(6−5), and H2O emission in G09v1.97. The contours are at 30, 40, 60, 80, 100% levels of the maximum value of the individual tracer. The approximate beam, assuming a static magnification factor across the image, is shown in the bottom- left of the image. Bottom: Normalized enclosed flux in circular apertures increasing from the center of the CO(6−5), dust continuum, and H2O emission out to 80% of the total flux of the image. It is clear that the dust continuum emission is the most compact of the emission types, whereas the CO(6−5) and H2O emission closely match in emission extent.
Current usage metrics show cumulative count of Article Views (full-text article views including HTML views, PDF and ePub downloads, according to the available data) and Abstracts Views on Vision4Press platform.
Data correspond to usage on the plateform after 2015. The current usage metrics is available 48-96 hours after online publication and is updated daily on week days.
Initial download of the metrics may take a while.