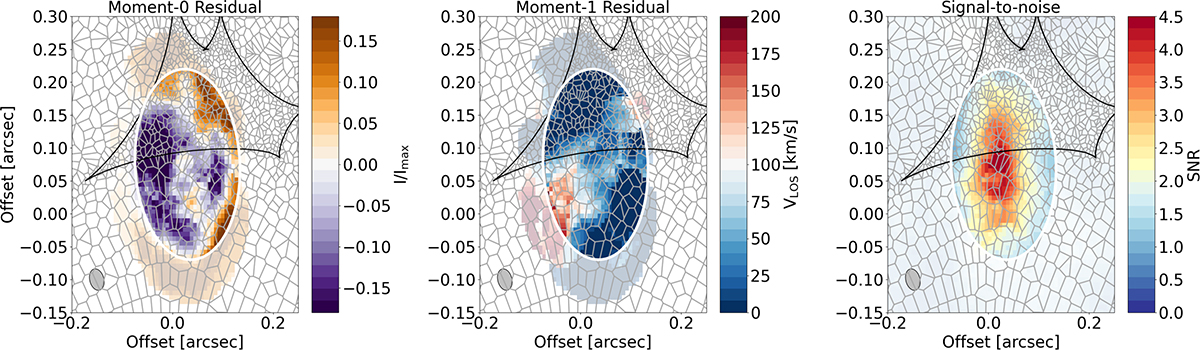
Fig. 13.
Download original image
Residual moment-0 and moment-1 maps from 3DBAROLO fitting and the S/N map of the emission using the source plane error map (i.e., source plane intensity/moment-0 divided by the source plane intensity error map) as described in Sect. 3.3.3. Note: the first two panels are a zoomed-in version of the same images shown as in Fig. 7 (rows 1 and 2, column 3), but with a different color scale. The grey grid shows the Voronoi pixels prior to interpolation to the square pixel grid, as described in Sect. 3.3.3. The black line shows the caustic line and the white ellipse shows the region used for 3DBAROLO fitting (i.e., the final ring). As in Fig. 7, any emission outside the fitting region is semi-transparent. The approximate beam, assuming a static magnification factor across the image, is shown in the bottom- left of the image.
Current usage metrics show cumulative count of Article Views (full-text article views including HTML views, PDF and ePub downloads, according to the available data) and Abstracts Views on Vision4Press platform.
Data correspond to usage on the plateform after 2015. The current usage metrics is available 48-96 hours after online publication and is updated daily on week days.
Initial download of the metrics may take a while.