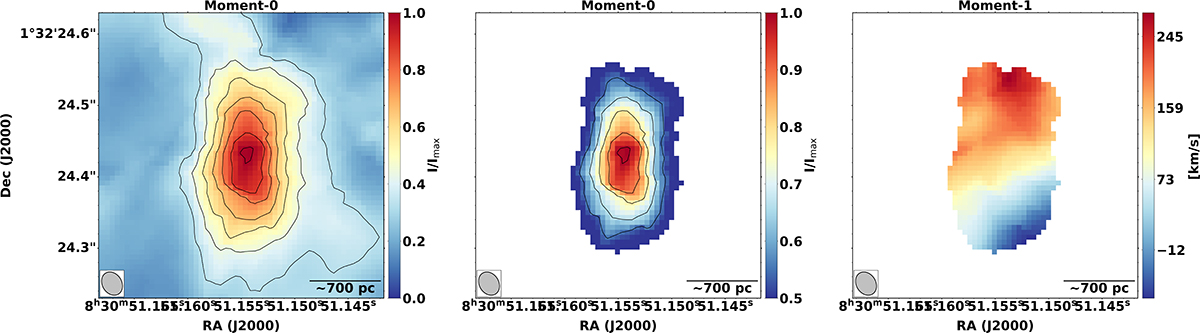
Fig. B.2.
Download original image
Source plane CO(6−5) masked and unmasked moment-0 and moment-1 maps created from the source plane emission cube described in Sect. 3.3.3. The first panel shows the full moment-0 map with contours shown at −3, −2, 3, 4, 5, 6, 7, 8, 9, 10σ levels. The middle panel shows the moment-0 map masked to show only values above 4σ levels where the contours are shown at 5, 6, 7, 8, 9, 10σ levels. The right panel shows the moment-1 map masked to show only values above 4σ levels. The intensity values are in arbitrary units for both the unmasked and masked moment-0 maps as output from PYAUTOLENS. The approximate beam, assuming a static magnification factor across the image, is shown in the bottom-left of each image. A clear velocity gradient is seen in the moment-1 emission map.
Current usage metrics show cumulative count of Article Views (full-text article views including HTML views, PDF and ePub downloads, according to the available data) and Abstracts Views on Vision4Press platform.
Data correspond to usage on the plateform after 2015. The current usage metrics is available 48-96 hours after online publication and is updated daily on week days.
Initial download of the metrics may take a while.