Fig. B.3.
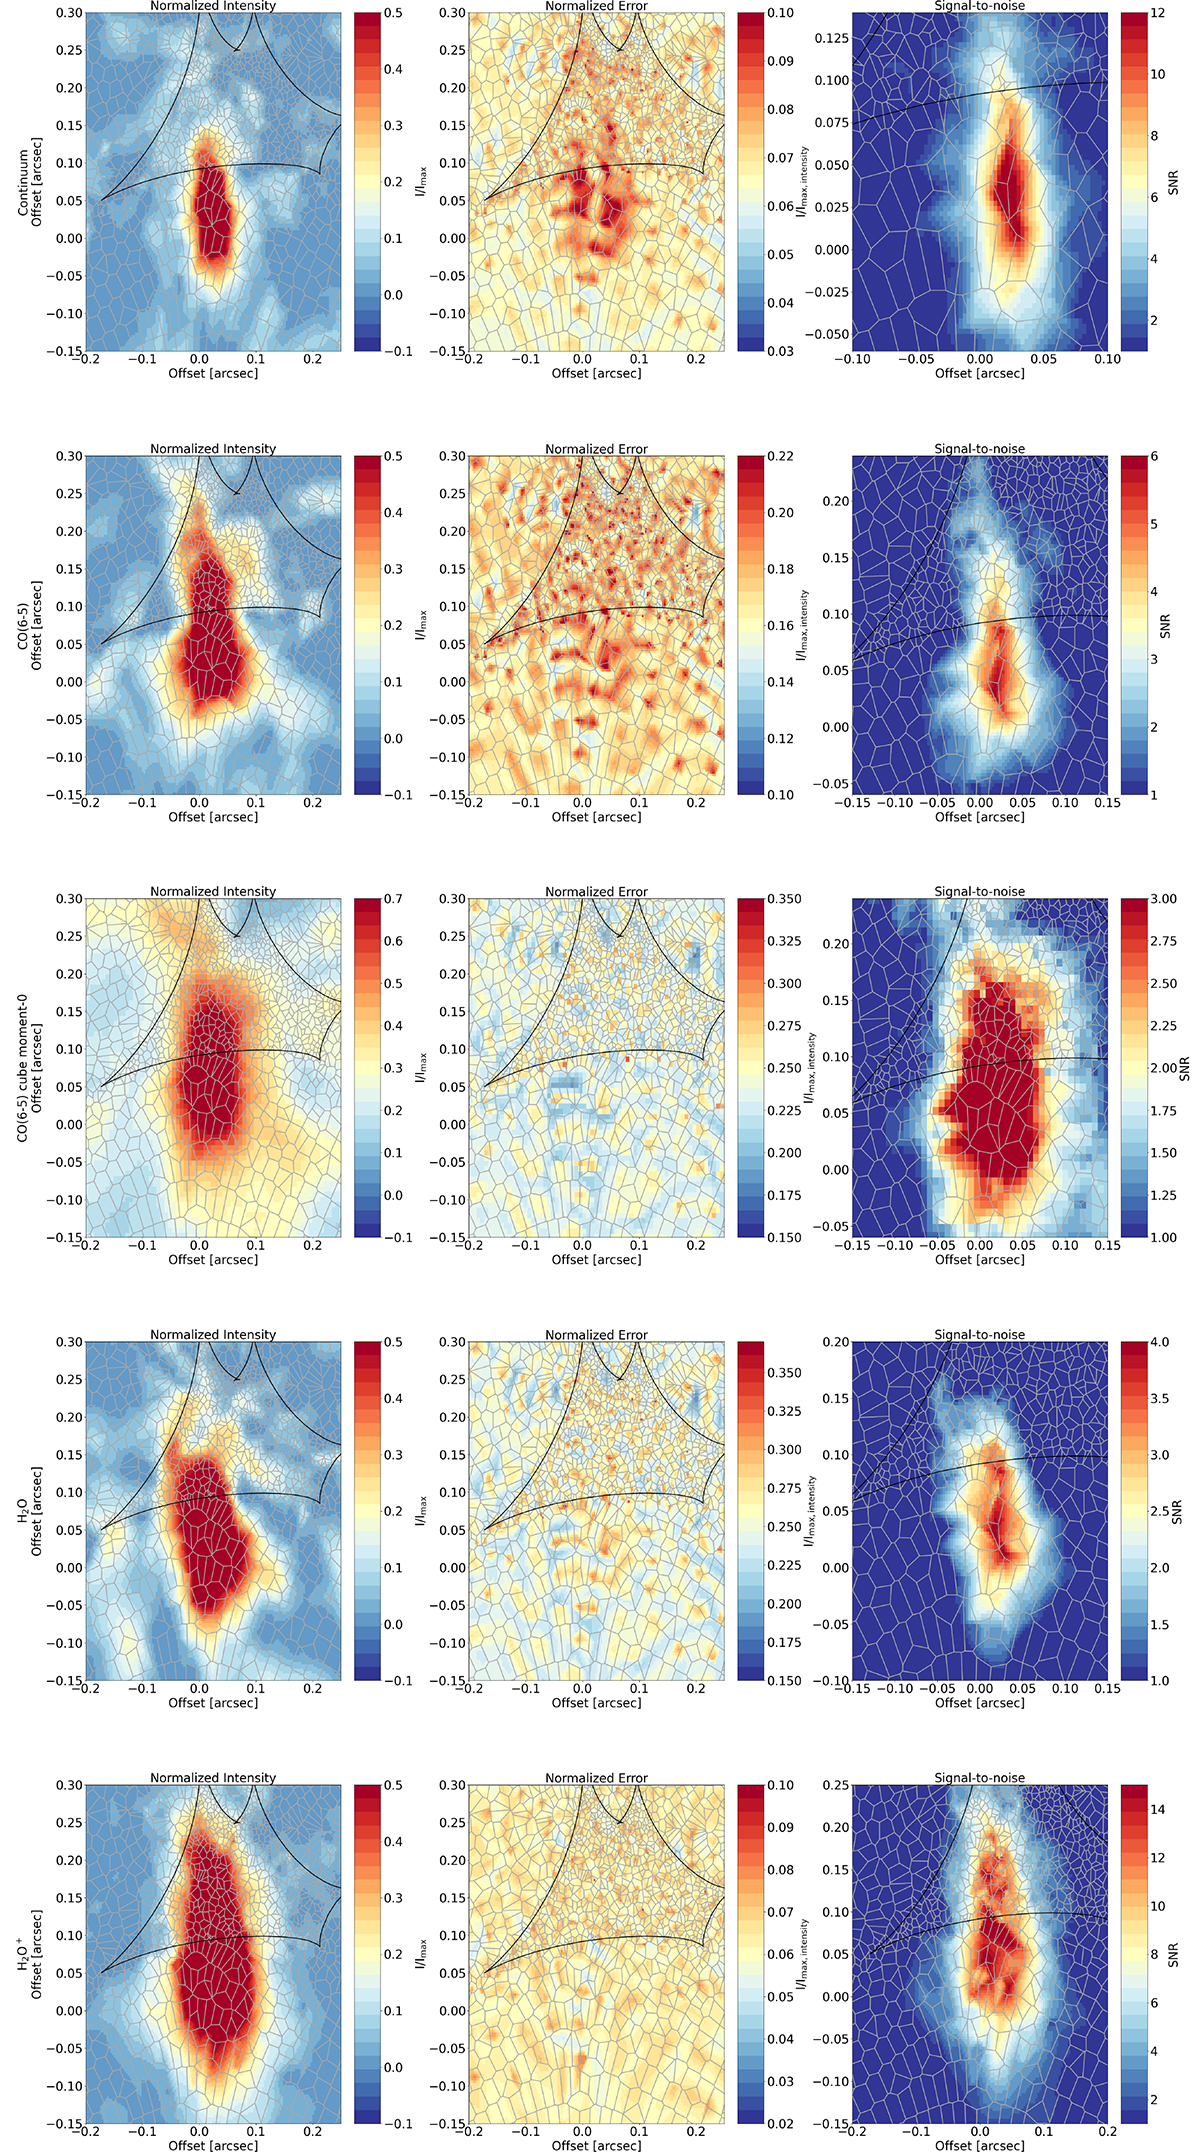
Download original image
Source plane intensity (left panels), error map (middle panels), and S/N map (right panels) for the continuum (top), CO(6−5) (second row), CO(6−5) source plane emission cube (third row), H2O (fourth row), and H2O+ (bottom row) emission. The grey grid shows the Voronoi pixels prior to interpolation to the square pixel grid, as described in Sect. 3.3.3. The black line shows the caustic line. Note: the error maps have been normalized by the maximum value in the respective intensity map and, therefore, the error maps can be seen as a percentage error for each pixel. For the CO(6−5) source plane cube the intensity map is the source plane moment-0 map and the intensity map is a moment-0 map of the error cube as described in Sect. 3.3.3. Note: the S/N map is zoomed-in compared to the other two panels.
Current usage metrics show cumulative count of Article Views (full-text article views including HTML views, PDF and ePub downloads, according to the available data) and Abstracts Views on Vision4Press platform.
Data correspond to usage on the plateform after 2015. The current usage metrics is available 48-96 hours after online publication and is updated daily on week days.
Initial download of the metrics may take a while.