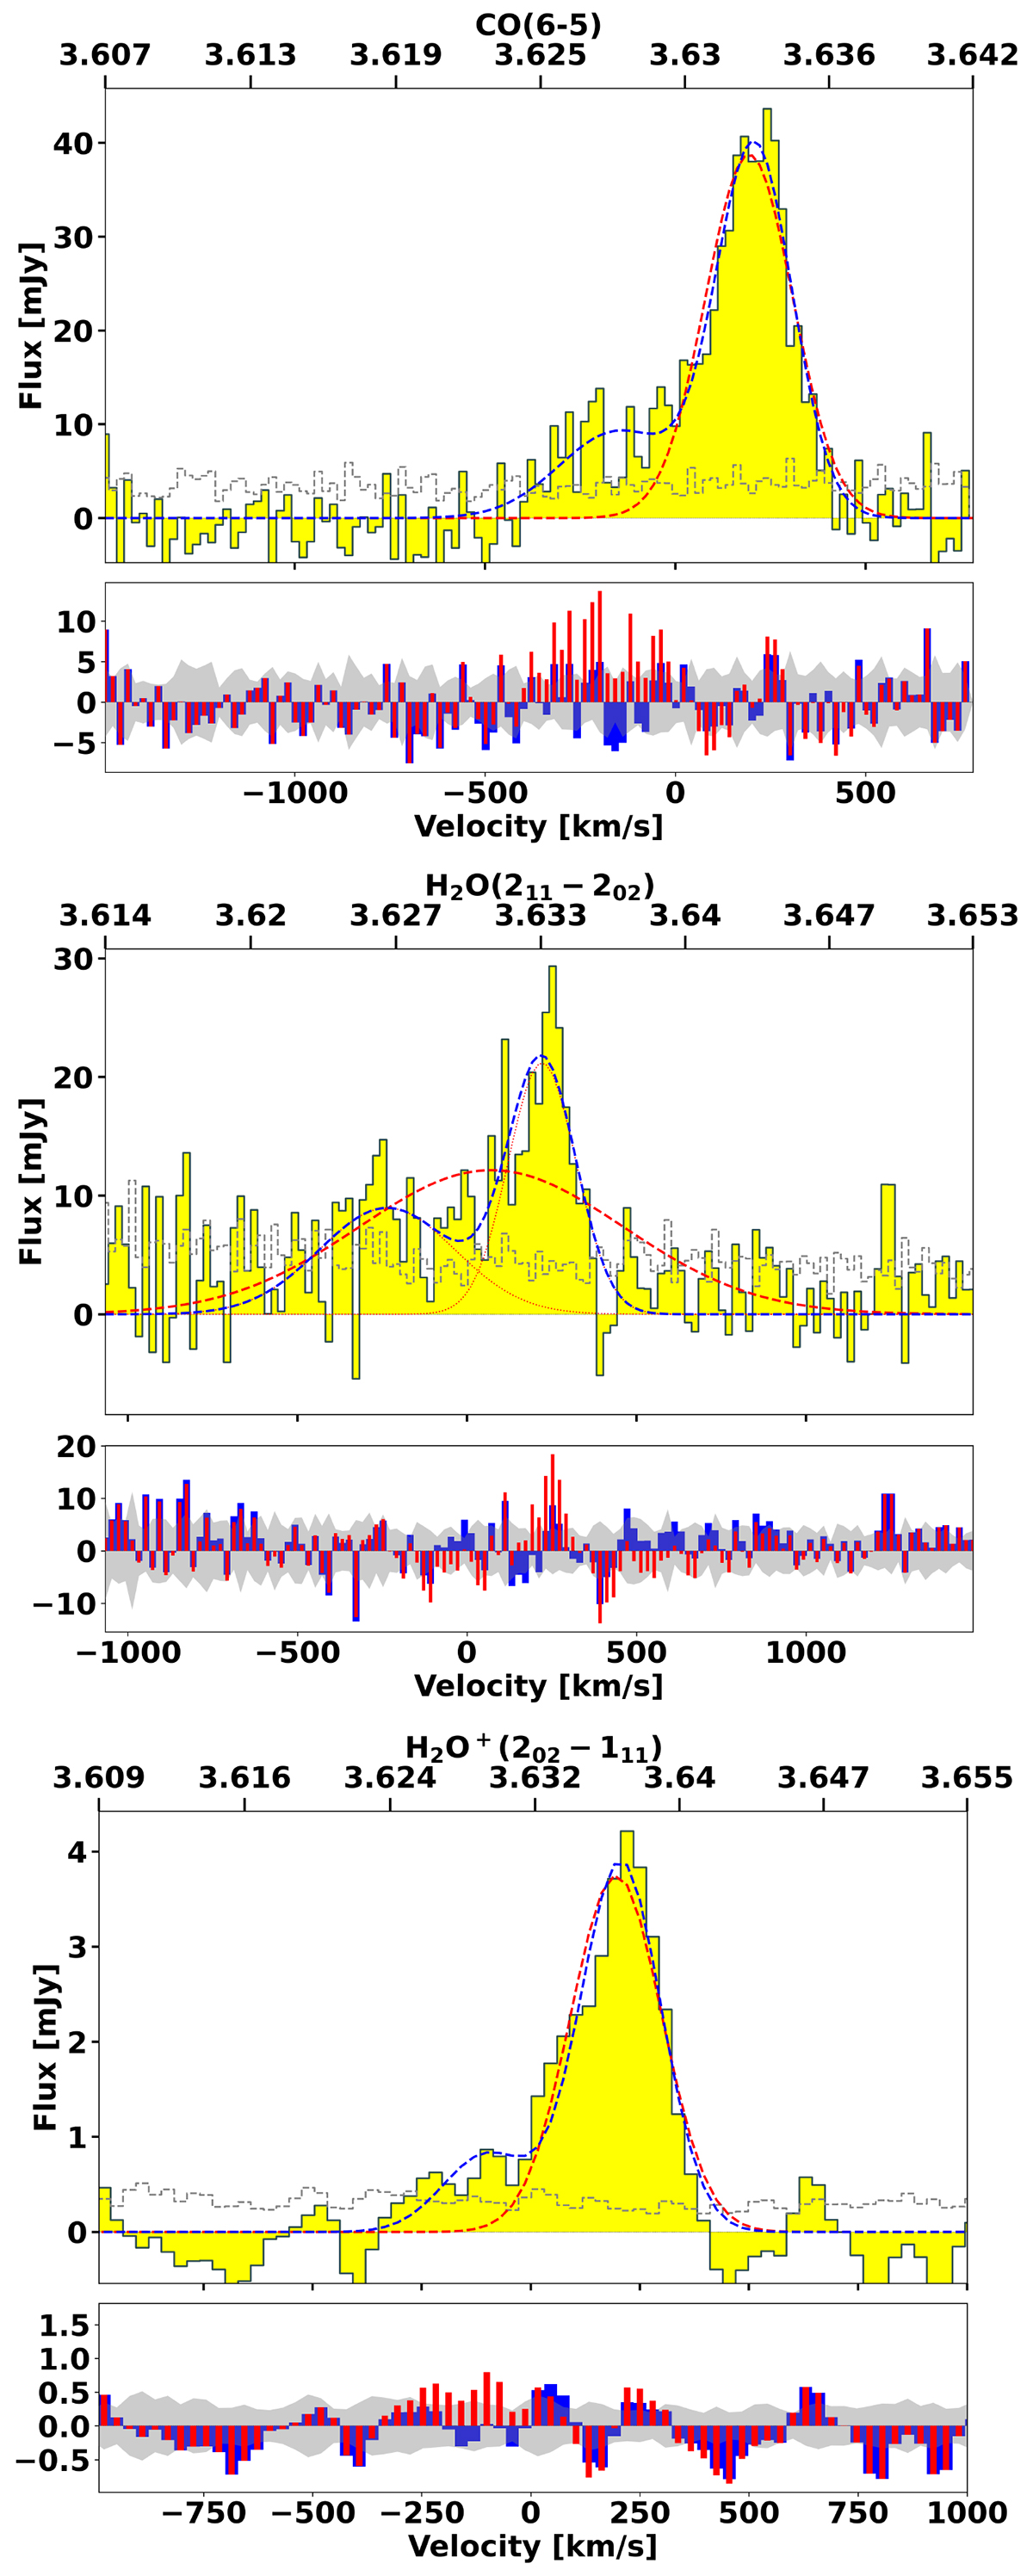
Fig. 2.
Download original image
Spectra of the detected molecular line species in G09v1.97. Top-left: CO(6−5) spectrum. Top-right: H2O spectrum. Bottom: H2O+ spectrum. Note: the H2O+ emission was not detected in the high-resolution data and, thus, the spectrum was taken from the combined data (as described in Sects. 2 and 3.2), resulting in a different spectral resolution than for the CO(6−5) and H2O emission. The spectrum for each molecule was extracted from a region corresponding to the region shown in Fig. 1. For each molecule, the spectrum is shown in the top panel, and the residuals from the Gaussian fits are shown in the lower panel. Single Gaussian profiles are shown in red, while double Gaussian profiles are shown in blue; similarly, in the lower panel, the residuals from fitting using a single Gaussian profile are shown in red and in blue for fits using two Gaussian profiles. It is clear that double Gaussian profiles offer a better fit of the spectra for all detected molecular line species. The dashed gray line in the top panel and the gray region in the lower panel represent the per-channel RMS. The top axis in the top panel for each spectrum shows the corresponding redshift. Note: the red residuals in the bottom panel are shown as slightly narrower (i.e., appearing to have a smaller channel width) than the blue, which is purely for clarity purposes.
Current usage metrics show cumulative count of Article Views (full-text article views including HTML views, PDF and ePub downloads, according to the available data) and Abstracts Views on Vision4Press platform.
Data correspond to usage on the plateform after 2015. The current usage metrics is available 48-96 hours after online publication and is updated daily on week days.
Initial download of the metrics may take a while.