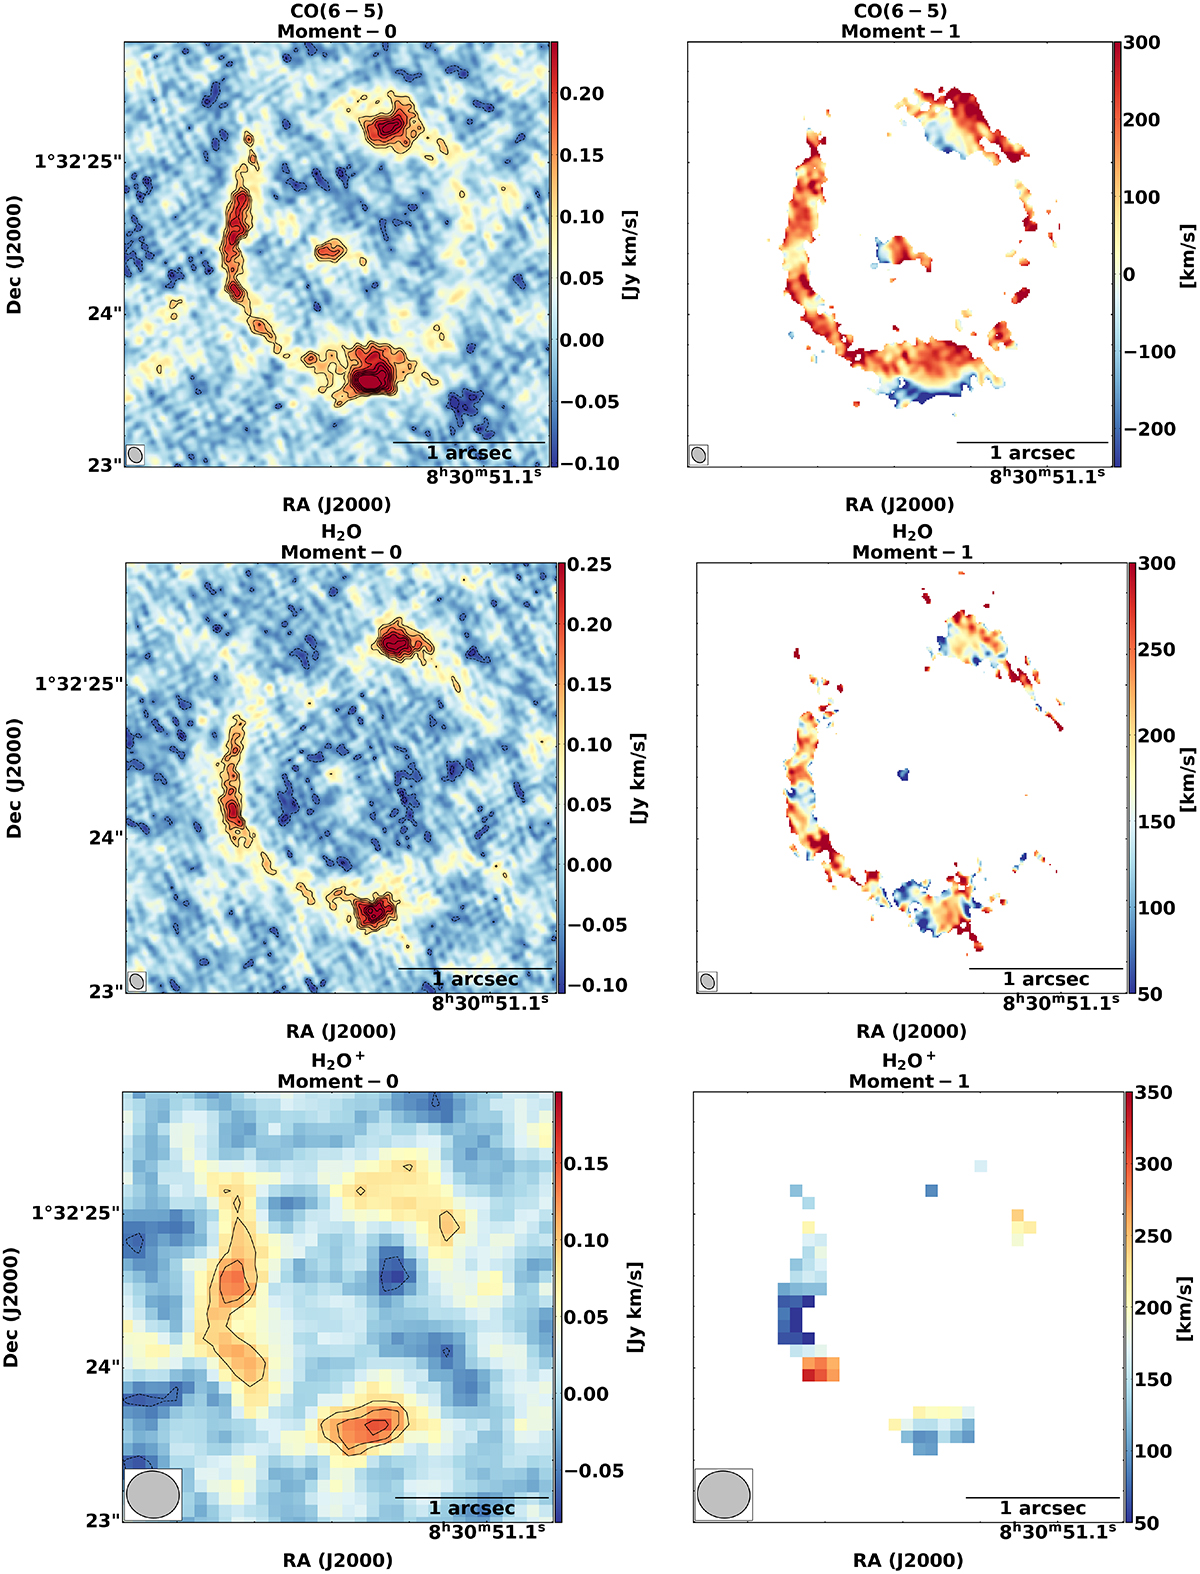
Fig. 3.
Download original image
Moment-0 and moment-1 maps of the molecular line emission detected towards G09v1.97. Top: CO(6−5). Middle: H2O. Bottom: H2O+. The contours are shown at −3, −2, 3, 4, 5, 6, 7, 8, 9, 10σ levels for the CO(6−5) and H2O emission and at −3, −2, 3, 4, 5σ levels for the H2O+ emission. The synthesized beam is shown in the bottom- left of every image, beam sizes can be found in Table 1 for each line. Note: the angular resolution is significantly lower for the H2O+ emission as it was imaged from the combined dataset as described in Sect. 2. A clear velocity gradient is visible in the moment-1 map of the CO(6−5) emission.
Current usage metrics show cumulative count of Article Views (full-text article views including HTML views, PDF and ePub downloads, according to the available data) and Abstracts Views on Vision4Press platform.
Data correspond to usage on the plateform after 2015. The current usage metrics is available 48-96 hours after online publication and is updated daily on week days.
Initial download of the metrics may take a while.