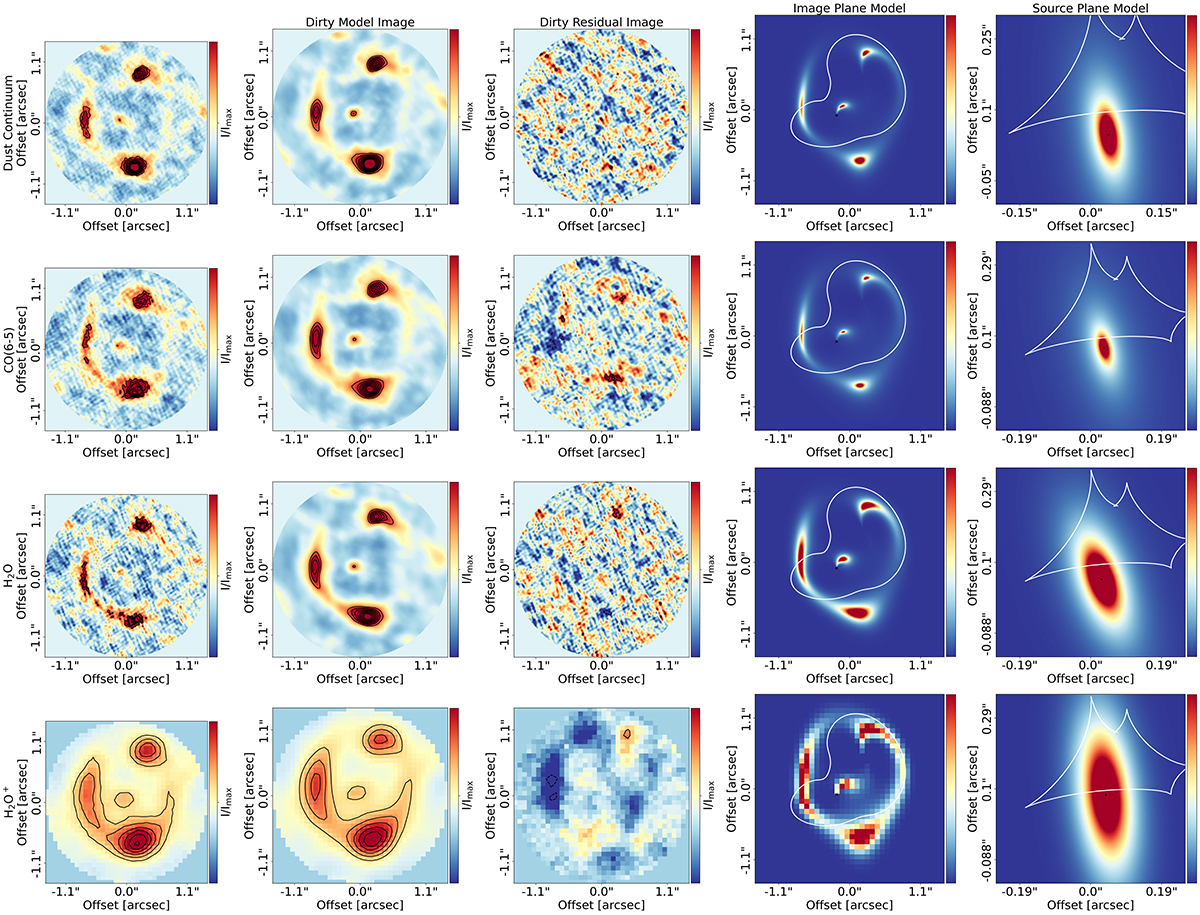
Fig. 5.
Download original image
Parametric lens and source modeling results for the detected emission towards G09v1.97. First row: Dust continuum. Second row: CO(6−5). Third row: H2O. Fourth row: H2O+ emission. The first column shows the dirty image as produced by PYAUTOLENS with contours shown at 3, 4, 5, 6, 7, 8, 9, 10σ levels, where 1σ is the rms of a blank region of the image. Note: this is not a cleaned image and structures may look slightly different than those shown in cleaned images. The second column shows the dirty model image as produced by PYAUTOLENS with contours shown at 3, 4, 5, 6, 7, 8, 9, 10σ levels. The third column shows the dirty residual image produced by PYAUTOLENS with contours shown at the −3, −2, 2, 3, 4, 5σ levels. The fourth column shows the image plane emission parametric model of the data produced by PYAUTOLENS. The white line represents the critical line. The fifth column shows the source plane emission parametric model of the data produced by PYAUTOLENS. The white line shows the caustic line. All images are centered around the ALMA phase center for each image. Note: the H2O+ emission is of significantly lower angular resolution as the lensing model was created using the combined data, as described in Sect. 2.
Current usage metrics show cumulative count of Article Views (full-text article views including HTML views, PDF and ePub downloads, according to the available data) and Abstracts Views on Vision4Press platform.
Data correspond to usage on the plateform after 2015. The current usage metrics is available 48-96 hours after online publication and is updated daily on week days.
Initial download of the metrics may take a while.