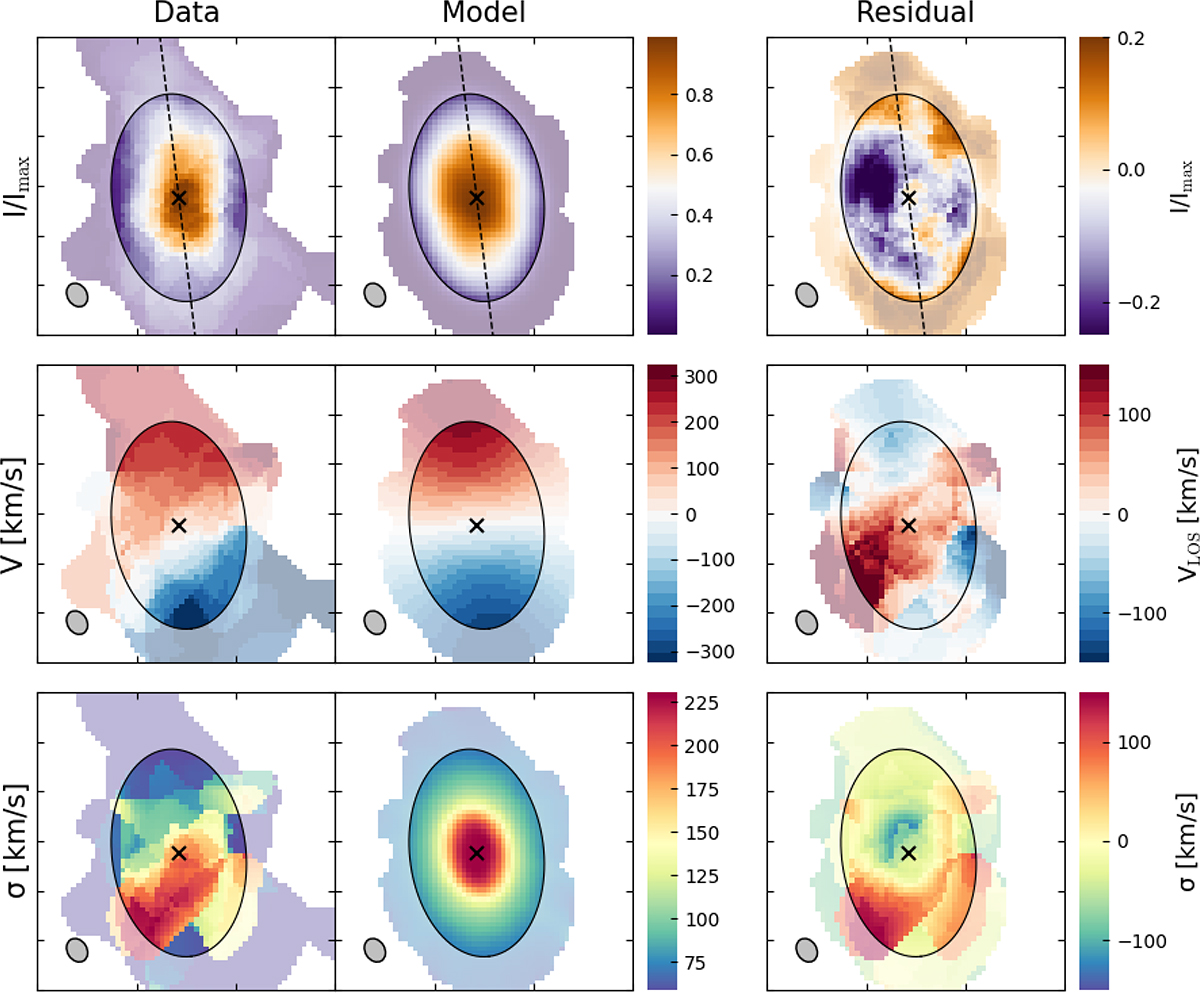
Fig. 7.
Download original image
Fitting results from 3DBAROLO with parameters set as described in Sect. 3.4. For all rows, the first column shows the data, the second the model, and the third the residual (data minus model). The first row shows the moment-0 emission (intensity), the second the velocity field (rotational velocity, Vrot), and the third the velocity dispersion (σ). The final 3DBAROLO ring is shown as the black ellipse and regions outside this ellipse are made semi-transparent to emphasize the region used for fitting. The major axis is shown in the first two rows by the dashed grey line. The kinematic center is shown by the green line in the first two columns of the second row. The approximate beam, assuming a static magnification factor across the image, is shown in the bottom-left of each image.
Current usage metrics show cumulative count of Article Views (full-text article views including HTML views, PDF and ePub downloads, according to the available data) and Abstracts Views on Vision4Press platform.
Data correspond to usage on the plateform after 2015. The current usage metrics is available 48-96 hours after online publication and is updated daily on week days.
Initial download of the metrics may take a while.