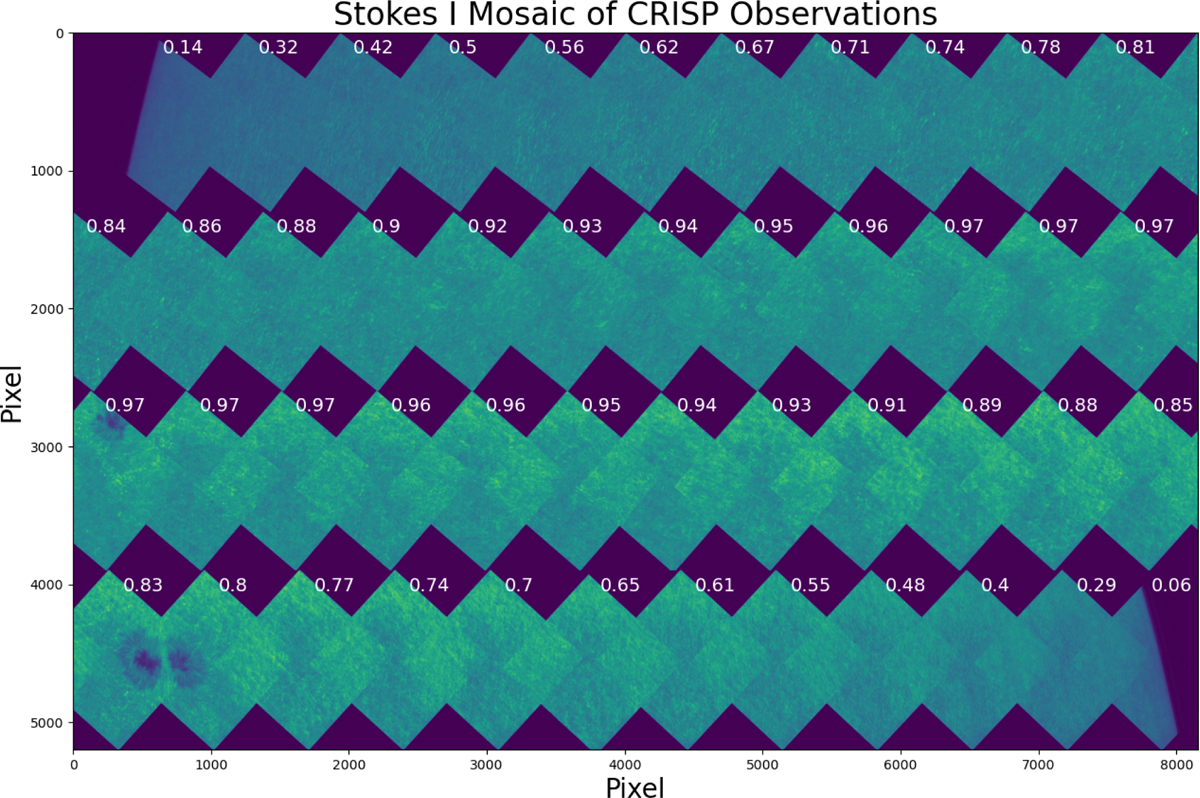
Fig. 1
Download original image
Intensity map in Stokes I of all 47 observations. The mosaic is split into four parts for readability. Observations are taken from the western to eastern sides of the Sun. No merging images into a single mosaic using the overlap regions was attempted. To the upper right of each observation square is the μ value of each observation. All observations shown here come from the Stokes I observations of the Fe I 6301 Å line with a matched colour bar, with brighter colour showing more flux.
Current usage metrics show cumulative count of Article Views (full-text article views including HTML views, PDF and ePub downloads, according to the available data) and Abstracts Views on Vision4Press platform.
Data correspond to usage on the plateform after 2015. The current usage metrics is available 48-96 hours after online publication and is updated daily on week days.
Initial download of the metrics may take a while.