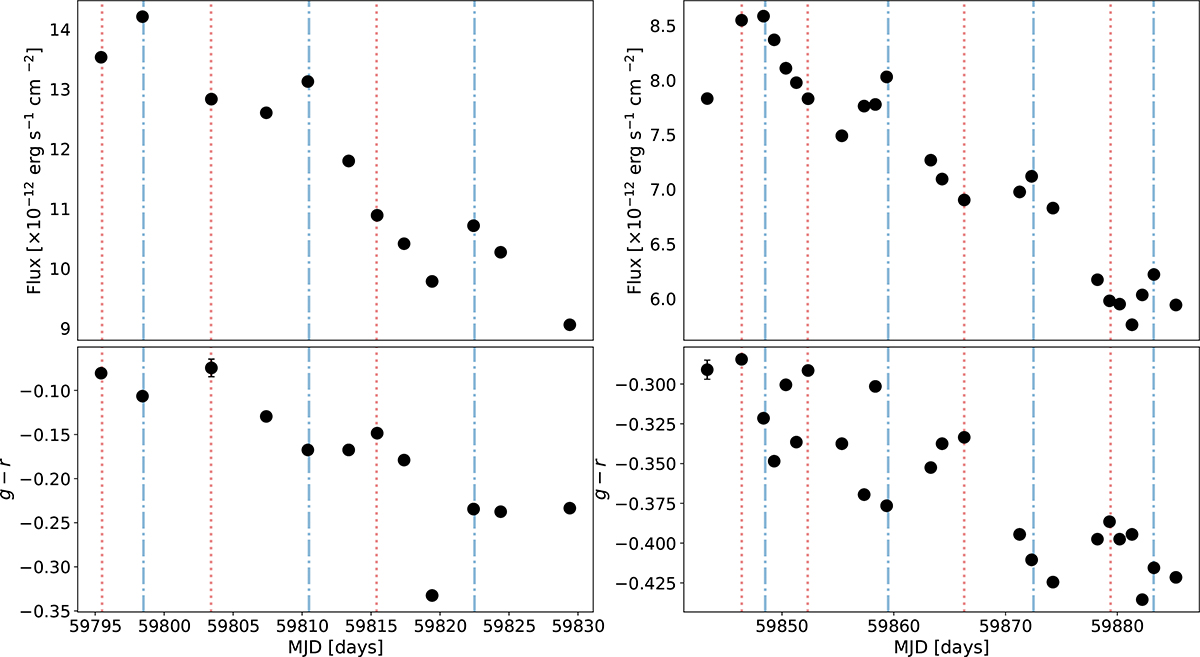
Fig. 10.
Download original image
Top panels: Total (g + r) flux corrected by reddening (E(B − V) = 0.27) following the Fitzpatrick (1999) reddening law for two regions with well-sampled light curves. Bottom panels: g − r colours (corrected by reddening) for the same two regions with well-sampled light curves. The vertical dash-dotted blue lines mark the observed flux maxima, and the vertical dashed red lines mark the colour maxima (redder colours). The flux and the colours show periodic undulations.
Current usage metrics show cumulative count of Article Views (full-text article views including HTML views, PDF and ePub downloads, according to the available data) and Abstracts Views on Vision4Press platform.
Data correspond to usage on the plateform after 2015. The current usage metrics is available 48-96 hours after online publication and is updated daily on week days.
Initial download of the metrics may take a while.