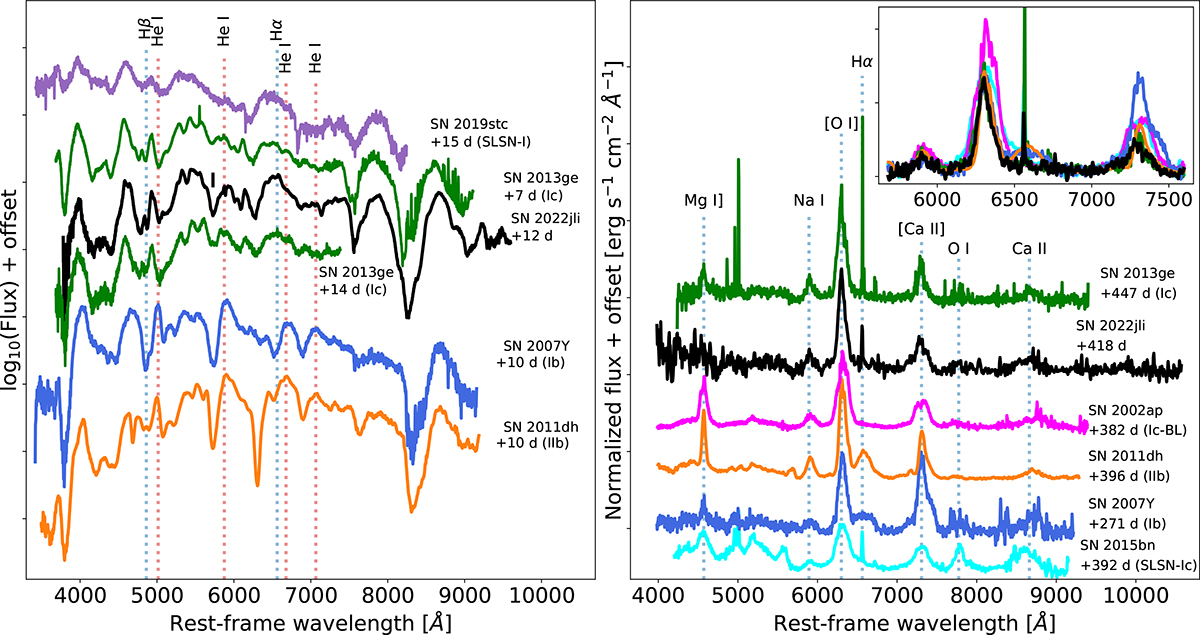
Fig. 14.
Download original image
Comparison of SN 2022jli with other SE SNe in decline from the first maximum and at a late nebular phase. On the left panel, SN 2022jli is compared at about +12 days relative to the first maximum, during the decline from maximum light, with the bumpy SLSNe-I SN 2019stc (Gomez et al. 2021), the Ic SN 2013ge (Drout et al. 2016), the Ib SN 2007Y (Stritzinger et al. 2009, 2023) and the IIb SN 2011dh (Ergon et al. 2014). The black tick marks the Na I D feature which is strong in SN 2022jli possibly due to the He Iλ5876 line contribution. Similarly, on the right panel, SN 2022jli is compared with the SLSN-I SN 2015bn (Nicholl et al. 2016a), the Ic-BL SN 2002ap (Shivvers et al. 2019), SN 2013ge and SN 2011dh (Ergon et al. 2015) at nebular phase. We indicate the rest-frame wavelength of the main spectral features. All the spectra have been corrected for reddening assuming RV = 3.1 and values from the literature, in the case of SN 2022jli we assume E(B − V)tot = 0.27 mag.
Current usage metrics show cumulative count of Article Views (full-text article views including HTML views, PDF and ePub downloads, according to the available data) and Abstracts Views on Vision4Press platform.
Data correspond to usage on the plateform after 2015. The current usage metrics is available 48-96 hours after online publication and is updated daily on week days.
Initial download of the metrics may take a while.