Fig. 16.
Download original image
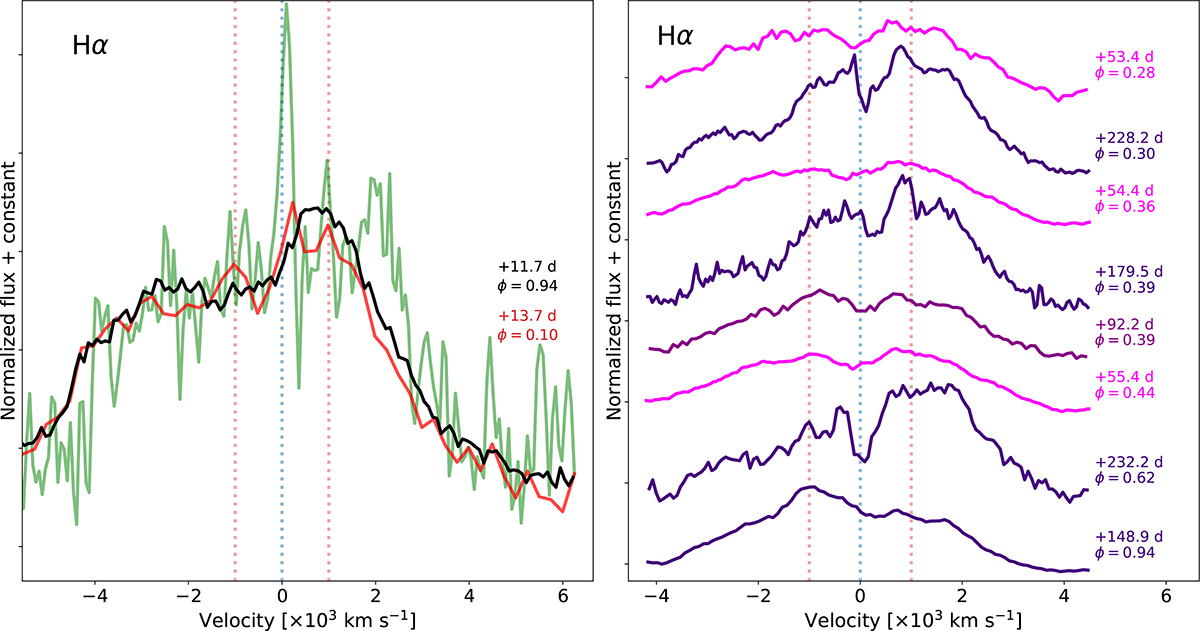
Velocity profile of the region around the Hα spectral feature. A pseudo-continuum on each side of the profile has been used to subtract the underlying continuum emission, and the result was normalised by the median residual flux over the region. On the left panel, the spectral region of SN 2022jli during the decline from the first maximum is compared with SN 2013ge (in green) at a similar spectral phase of ∼12 − 14 days. On the right hand panel, the evolution of the Hα velocity profiles of SN 2022jli from +53 days to +232 days are shown, during and after the second maximum, ordered with respect to the phase folded period of 12.472 days (ϕ). The near-maximum spectra are shown in magenta, the intermediate-phase spectrum at +92.1 days spectrum is shown in dark magenta, and the late-phase spectra (> + 100 days) is shown in indigo. The phase with respect to maximum and the periodic phase (ϕ) are indicated on the right of each spectrum. Vertical dotted red lines indicate a velocity of ±1000 km s−1 for comparison.
Current usage metrics show cumulative count of Article Views (full-text article views including HTML views, PDF and ePub downloads, according to the available data) and Abstracts Views on Vision4Press platform.
Data correspond to usage on the plateform after 2015. The current usage metrics is available 48-96 hours after online publication and is updated daily on week days.
Initial download of the metrics may take a while.