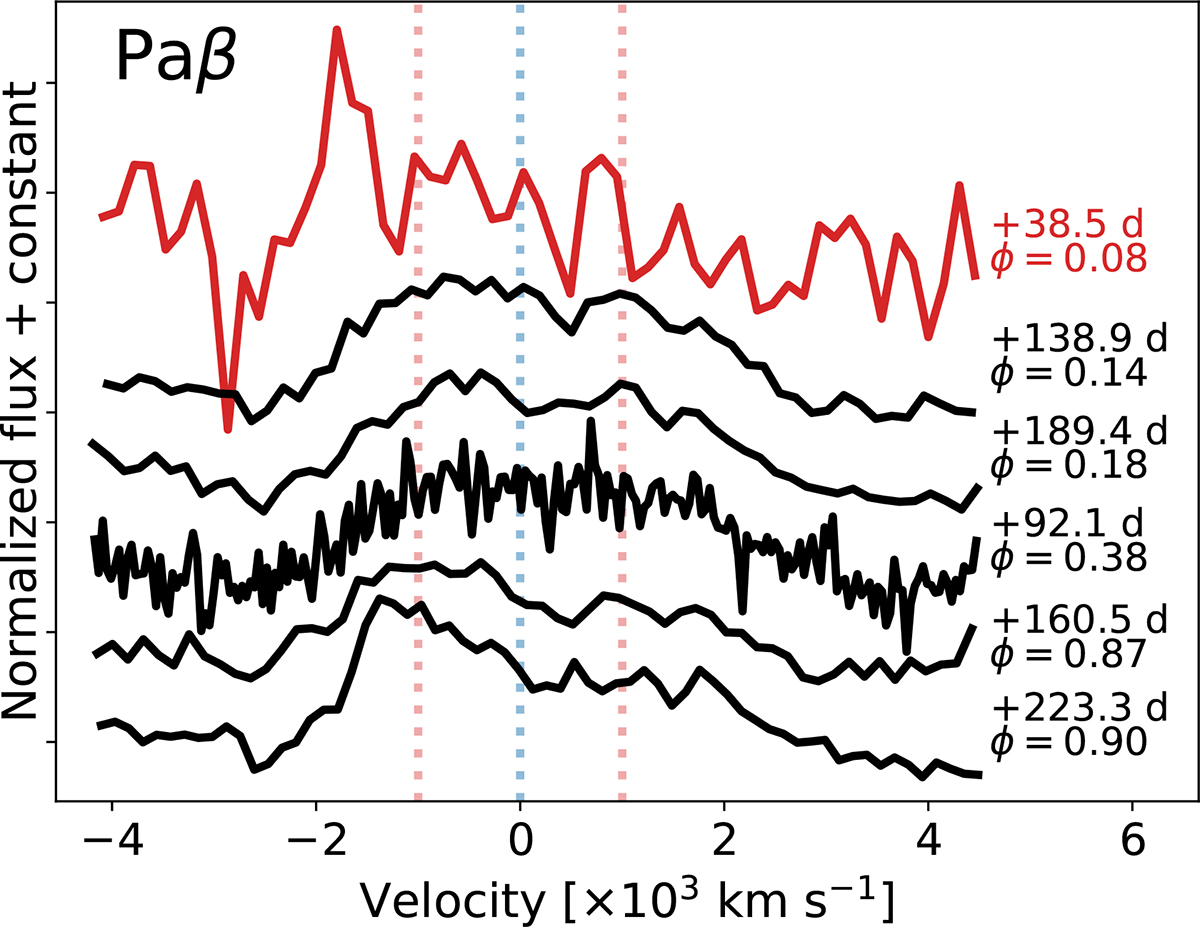
Fig. 17.
Download original image
Velocity profile of the region around the Paβ spectral feature in the NIR. As in the case of Hα, a pseudo-continuum on each side of the profile has been used to subtract the underlying continuum emission, and the result was normalised by the median residual flux over the region. Vertical dotted red lines indicate a velocity of ±1000 km s−1 for comparison.
Current usage metrics show cumulative count of Article Views (full-text article views including HTML views, PDF and ePub downloads, according to the available data) and Abstracts Views on Vision4Press platform.
Data correspond to usage on the plateform after 2015. The current usage metrics is available 48-96 hours after online publication and is updated daily on week days.
Initial download of the metrics may take a while.