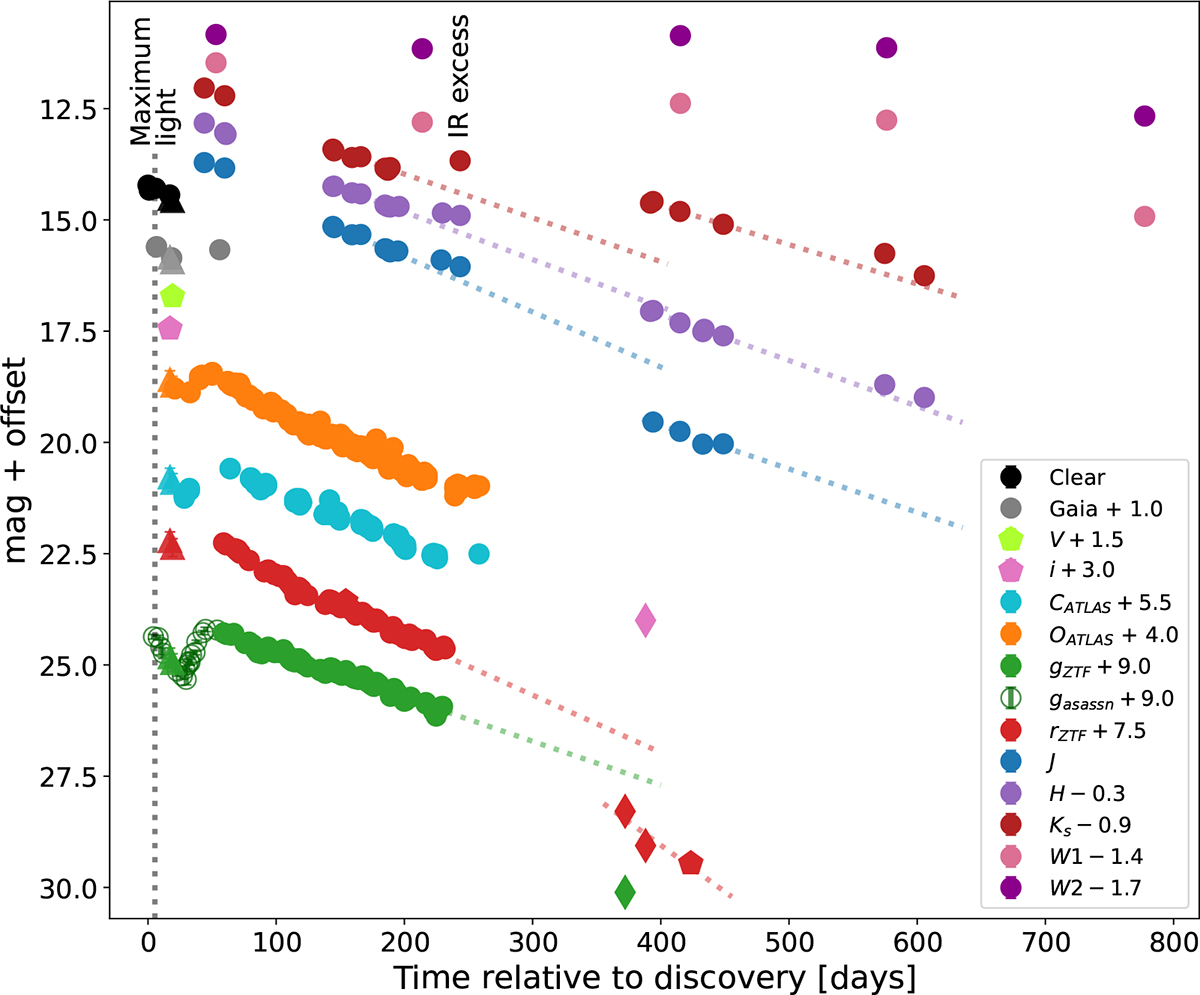
Fig. 2.
Download original image
Optical and NIR light curves of SN 2022jli. Circles correspond to survey photometry or NIR photometry repeatedly obtained using the same instrument or photometric system. Pentagons correspond to photometry computed from LDSS-3 and EFOSC2 spectroscopic acquisition images, diamonds are from late time Goodman photometry and triangles represent synthetic photometry computed from colour-matched spectra. The g-band photometry from ASAS-SN is shown using dark-green open circles to avoid confusion with other g-band photometry. The legend on the right specifies the colour code and the offsets employed to plot the different bands. Dotted lines are used to compare (extrapolate) the brightness decline from an early epoch to late times in a few relevant bands.
Current usage metrics show cumulative count of Article Views (full-text article views including HTML views, PDF and ePub downloads, according to the available data) and Abstracts Views on Vision4Press platform.
Data correspond to usage on the plateform after 2015. The current usage metrics is available 48-96 hours after online publication and is updated daily on week days.
Initial download of the metrics may take a while.