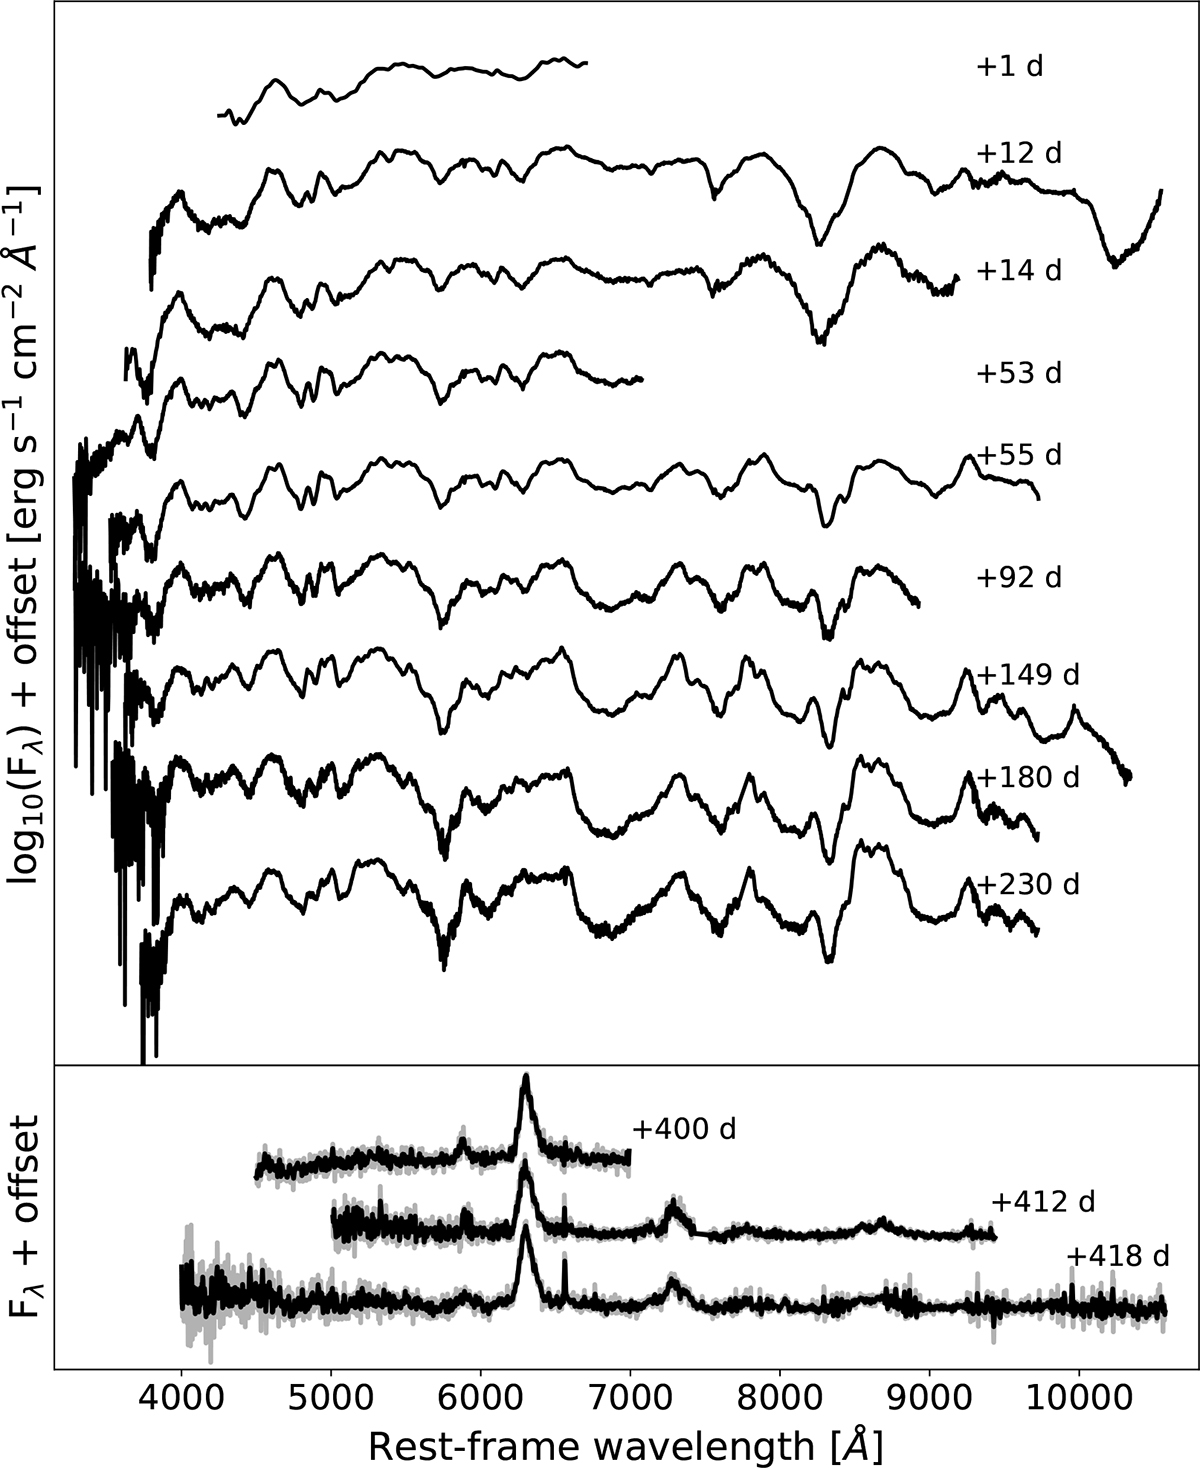
Fig. 3.
Download original image
Optical spectral sequence of SN 2022jli. The phase relative to the time of maximum light is indicated on the right. The spectra during the first +250 days are shown in the top panel in logarithmic scale, the nebular phase spectra are presented in the bottom panel. The smoothed nebular spectra using the Savitzky–Golay filter are shown in black, the original spectra are shown in grey.
Current usage metrics show cumulative count of Article Views (full-text article views including HTML views, PDF and ePub downloads, according to the available data) and Abstracts Views on Vision4Press platform.
Data correspond to usage on the plateform after 2015. The current usage metrics is available 48-96 hours after online publication and is updated daily on week days.
Initial download of the metrics may take a while.