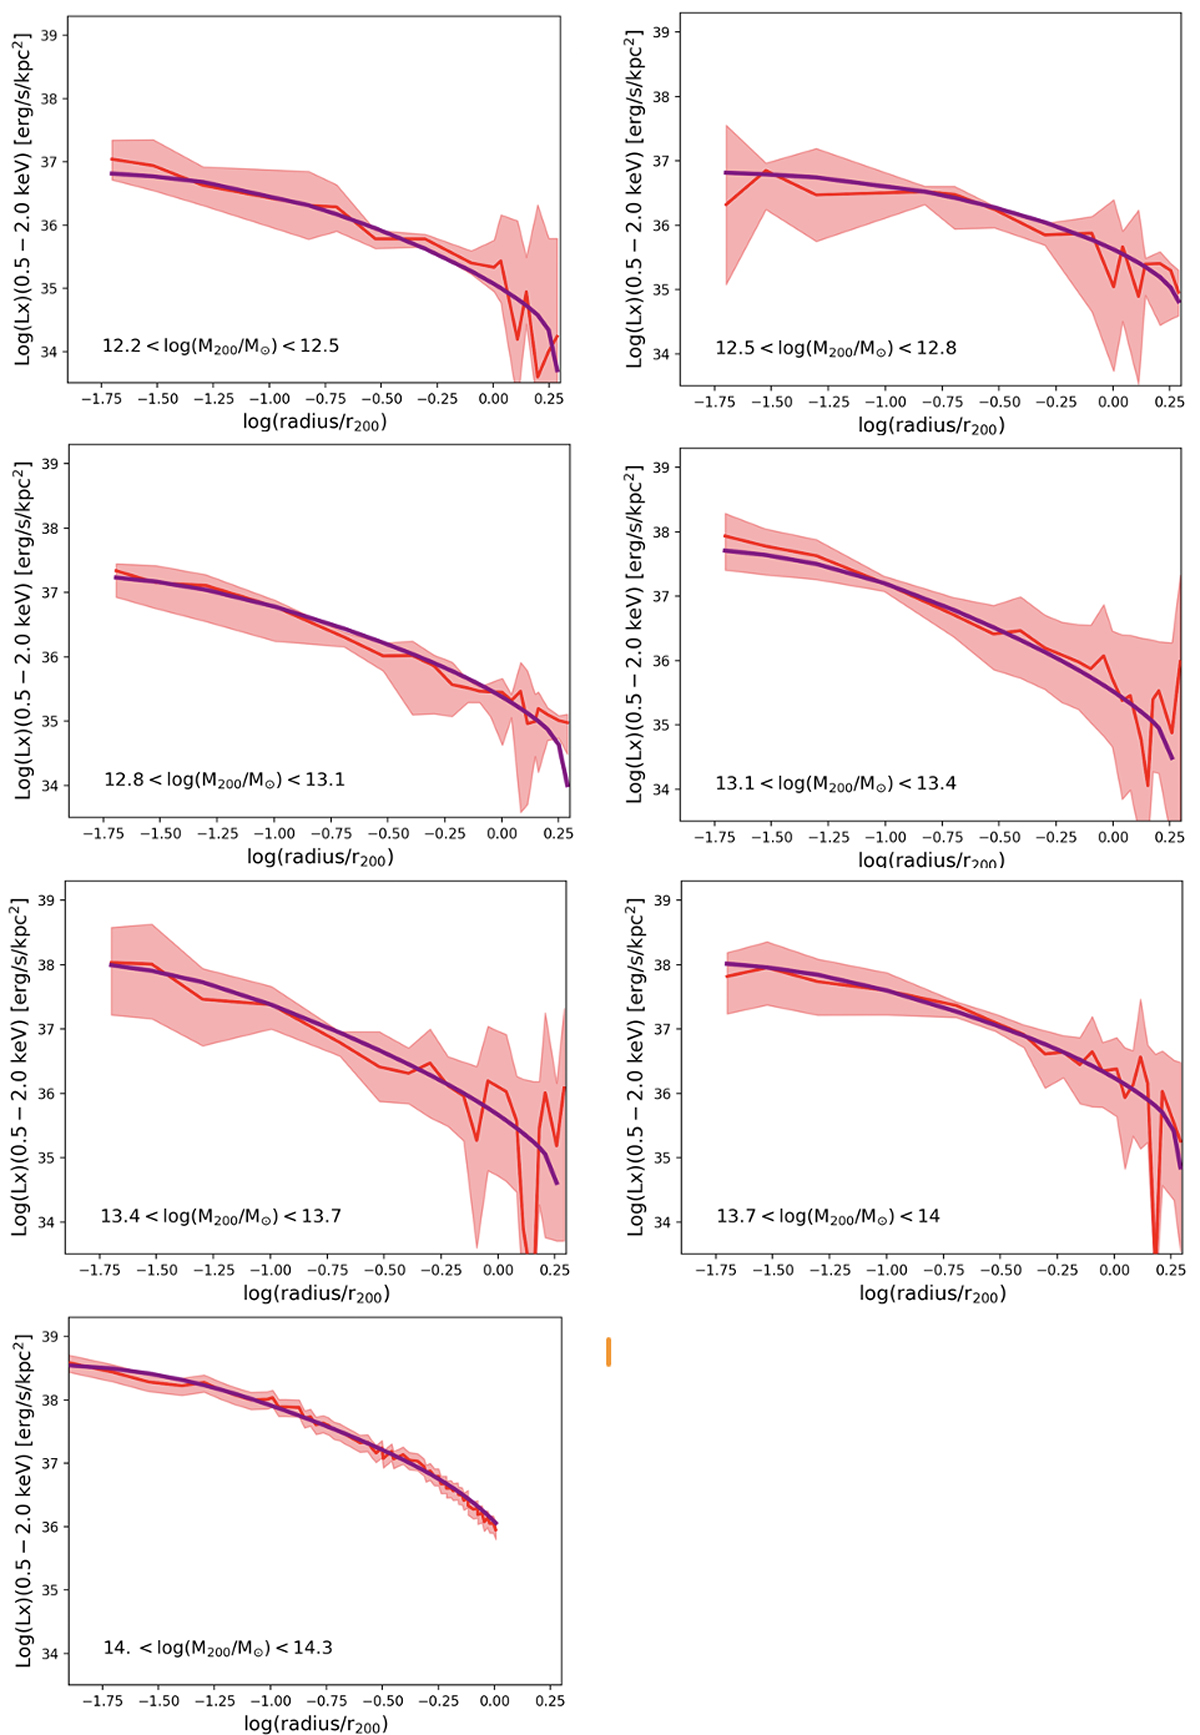
Fig. 1.
Download original image
X-ray surface brightness profile as estimated in Popesso et al. (2025a). The solid red line represents the stacked profile, while the pink shaded region indicates the uncertainty derived from bootstrapping. The panel in the last row displays the average X-ray surface brightness profile (solid red line) of the eFEDS detections with optical counterparts in the GAMA galaxy sample, corresponding to the specific halo mass bin, while the pink shaded region indicates the dispersion. The solid purple line in all panels shows the best-fit projected X-ray emissivity profile, represented by ne(r)2Λ(kT, Z).
Current usage metrics show cumulative count of Article Views (full-text article views including HTML views, PDF and ePub downloads, according to the available data) and Abstracts Views on Vision4Press platform.
Data correspond to usage on the plateform after 2015. The current usage metrics is available 48-96 hours after online publication and is updated daily on week days.
Initial download of the metrics may take a while.