Open Access
Fig. 2.
Download original image
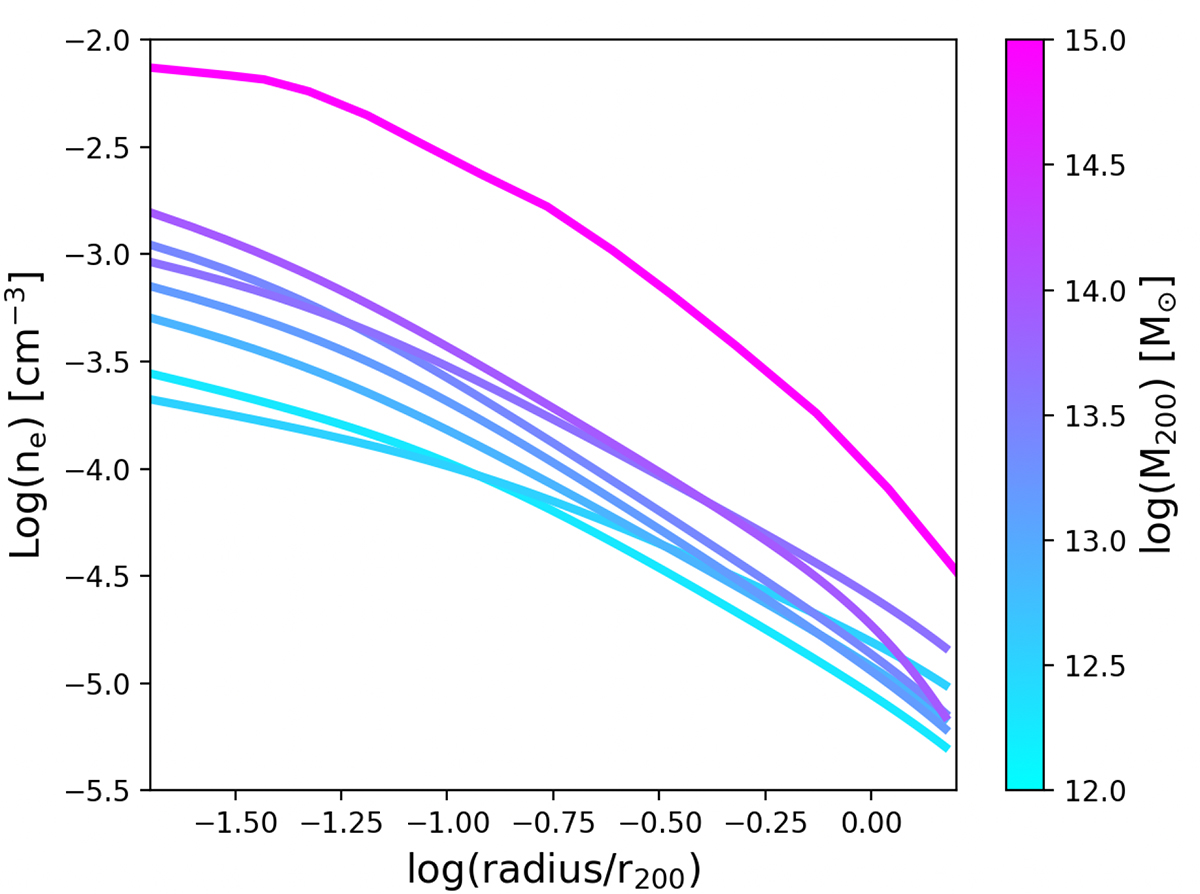
Electron density profiles of groups and clusters in the halo mass bins studied here. The profiles are color coded as a function of M200 as shown in the color bar. The magenta profile is obtained from the stacking in eROSITA of the CHEXMATE clusters, and it was taken from Lyskova et al. (2023).
Current usage metrics show cumulative count of Article Views (full-text article views including HTML views, PDF and ePub downloads, according to the available data) and Abstracts Views on Vision4Press platform.
Data correspond to usage on the plateform after 2015. The current usage metrics is available 48-96 hours after online publication and is updated daily on week days.
Initial download of the metrics may take a while.