Fig. 3.
Download original image
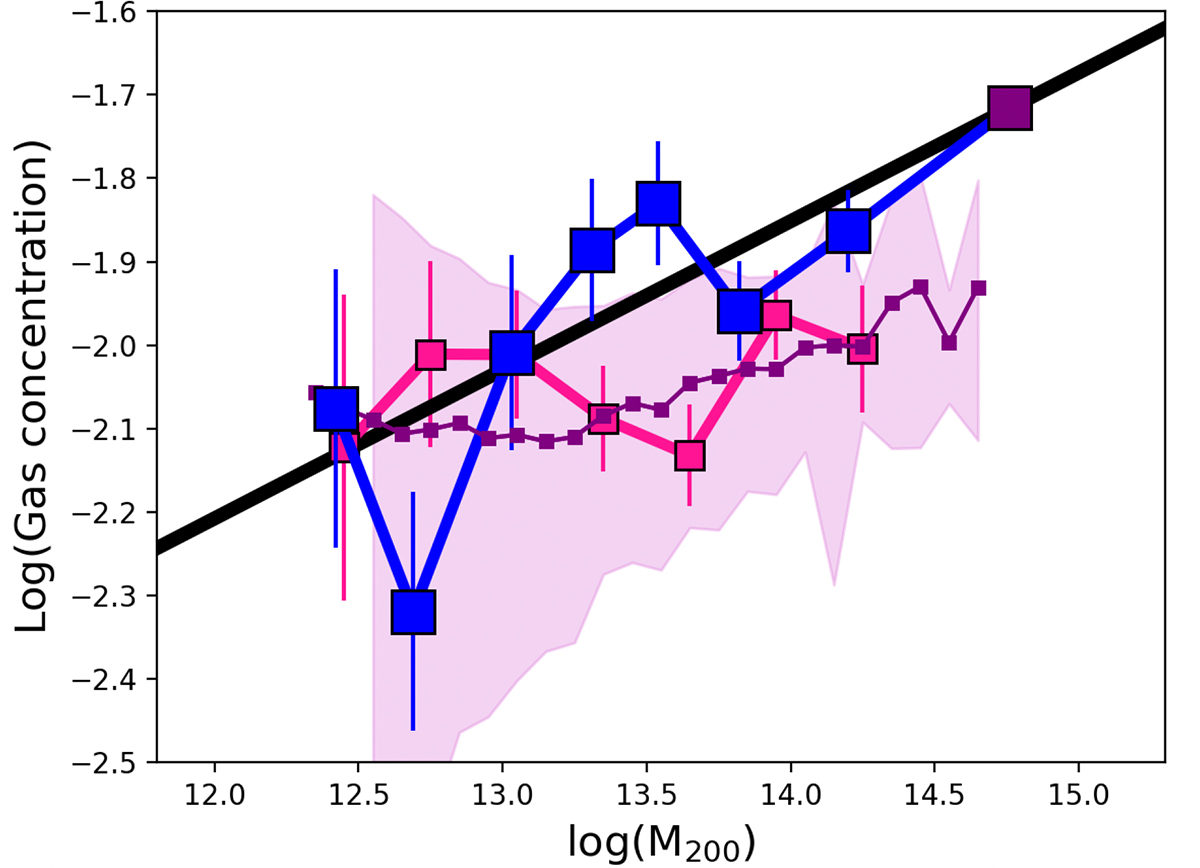
Relation between gas concentration, defined as the ratio of hot gas mass within 0.1 R200 to that within R200, versus halo mass. The blue points represent results derived from the stacked data. The big purple point shows the result based on the electron density profile of the CHEX-MATE clusters stacked in eROSITA (Lyskova et al. 2023). The solid black line represents the best-fit relation based on the combined stacks of eFEDS and CHEX-MATE data. The small purple points indicate the mean relation predicted by the Magneticum simulation, with the shaded region illustrating the dispersion around this relation. The pink squares display the results obtained using the same stacking technique applied in this study to the X-ray surface brightness profiles derived from mock galaxy groups selected using the Robotham et al. (2011) algorithm on the mock eROSITA data from the L30 lightcone of Magneticum.
Current usage metrics show cumulative count of Article Views (full-text article views including HTML views, PDF and ePub downloads, according to the available data) and Abstracts Views on Vision4Press platform.
Data correspond to usage on the plateform after 2015. The current usage metrics is available 48-96 hours after online publication and is updated daily on week days.
Initial download of the metrics may take a while.