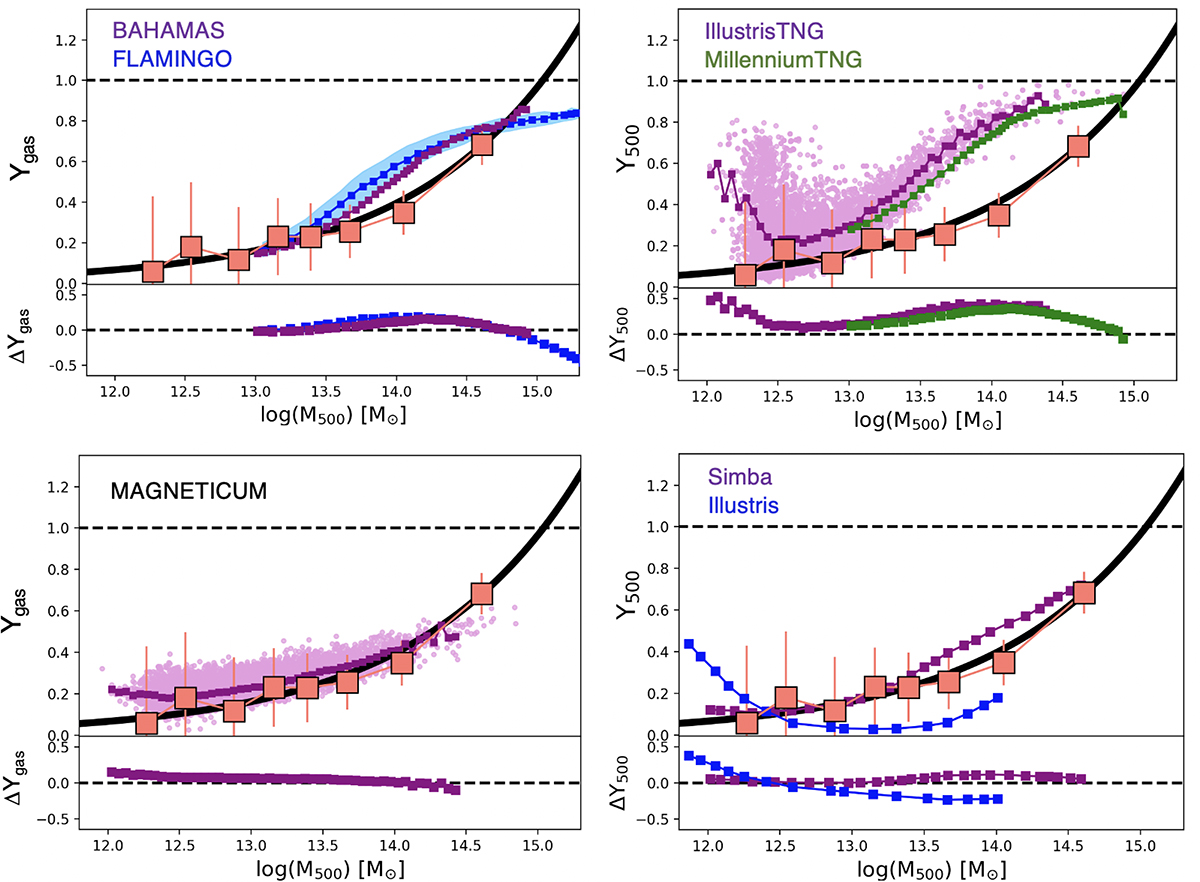
Fig. 6.
Download original image
Comparison of the observed Ygas versus mass relations within R500 with different hydrodynamical simulations. The color code for each dataset is indicated in each panel. The light orange squares show the stacked points of Fig. 4, while the black line shows our best-fit relation. The bottom subpanels show the residuals of each dataset to our best fit. These are expressed in dex (log(fgas)−log(fit)). Top-left panel: Comparison of Ygas–M500 relation with the predictions of the BAHAMAS (Salcido et al. 2023) and FLAMINGO (Schaye et al. 2023) simulations. The blue shaded region indicates the 1σ uncertainty of the relation in FLAMINGO as reported in the corresponding paper. These two simulations use similar galaxy evolution models and feedback implementations. Top-right panel: Comparison of Ygas–M500 relation with the predictions of the IllustrisTNG (Pillepich et al. 2019) and of MillenniumTNG (Pakmor et al. 2023) simulations. For IllustrisTNG we show the individual estimates (pink points) and the mean relation (purple squares). For MillenniumTNG we report the mean relation (green squares) retrieved in the corresponding paper. These two simulations use similar galaxy evolution models and feedback implementations. Bottom-left panel: Comparison of Ygas–M500 relation with the predictions of the Magneticum (Dolag et al. 2016). The pink points indicate the individual estimates, while the purple squares indicate the mean relation. Bottom-right panel: Comparison of Ygas–M500 relation with the predictions of the Simba (Davé et al. 2019) and Illustris (Genel et al. 2014).
Current usage metrics show cumulative count of Article Views (full-text article views including HTML views, PDF and ePub downloads, according to the available data) and Abstracts Views on Vision4Press platform.
Data correspond to usage on the plateform after 2015. The current usage metrics is available 48-96 hours after online publication and is updated daily on week days.
Initial download of the metrics may take a while.