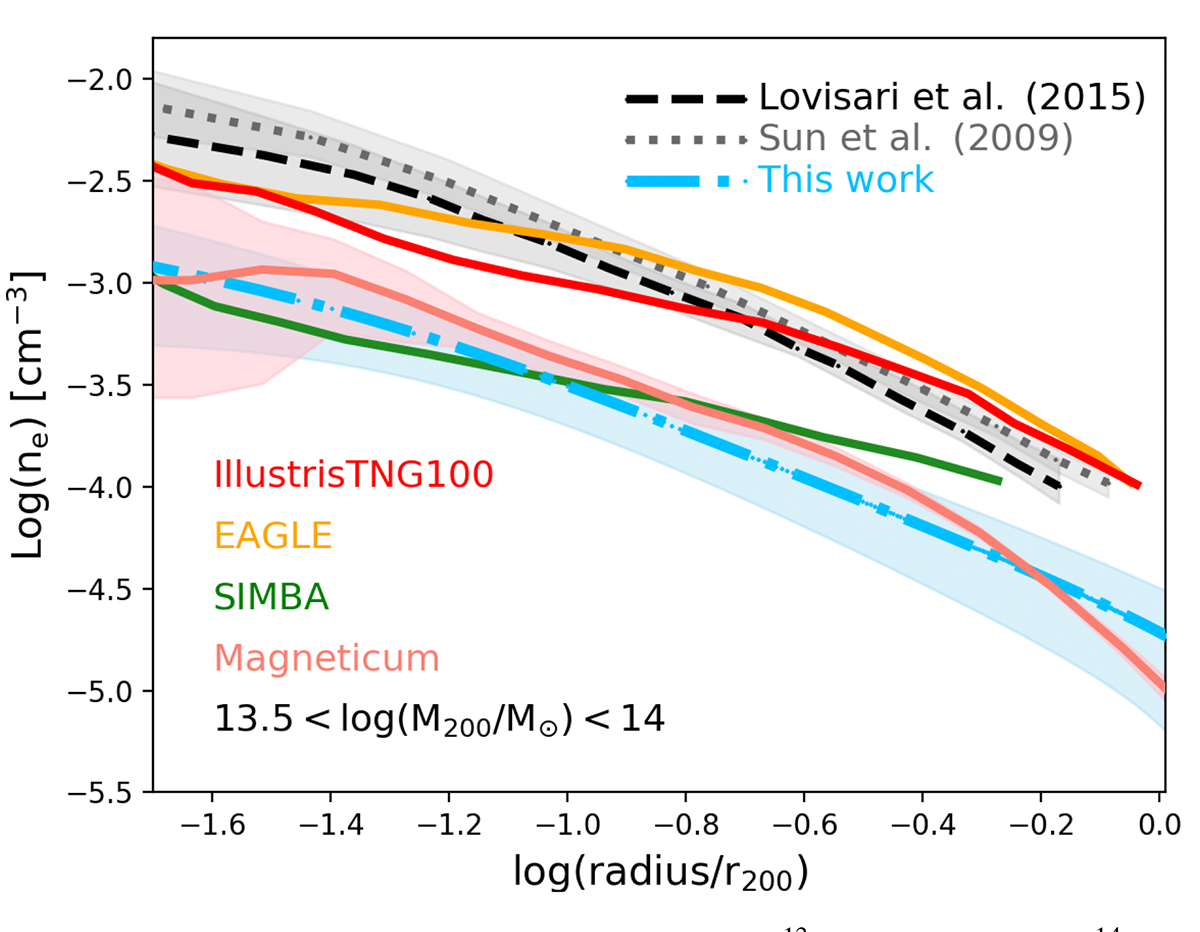
Fig. 7.
Download original image
Electron density profile for groups at 1013 M⊙ < M200 < 1014 M⊙ from this work (blue dashed-dotted curve), Lovisari et al. (2015) (black dashed curve) and Sun et al. (2009) (gray dotted curve), compared with the predictions of the hydrodynamical simulations in the same M200 mass bin: Magneticum (pink curve), IllustrisTNG100 (red curve), EAGLE (orange curve), and Simba (green curve). With the exclusion of the Magneticum data provided by Popesso et al. (2025b), the profiles of the simulations are taken from the review of Oppenheimer et al. (2021).
Current usage metrics show cumulative count of Article Views (full-text article views including HTML views, PDF and ePub downloads, according to the available data) and Abstracts Views on Vision4Press platform.
Data correspond to usage on the plateform after 2015. The current usage metrics is available 48-96 hours after online publication and is updated daily on week days.
Initial download of the metrics may take a while.