Fig. 8.
Download original image
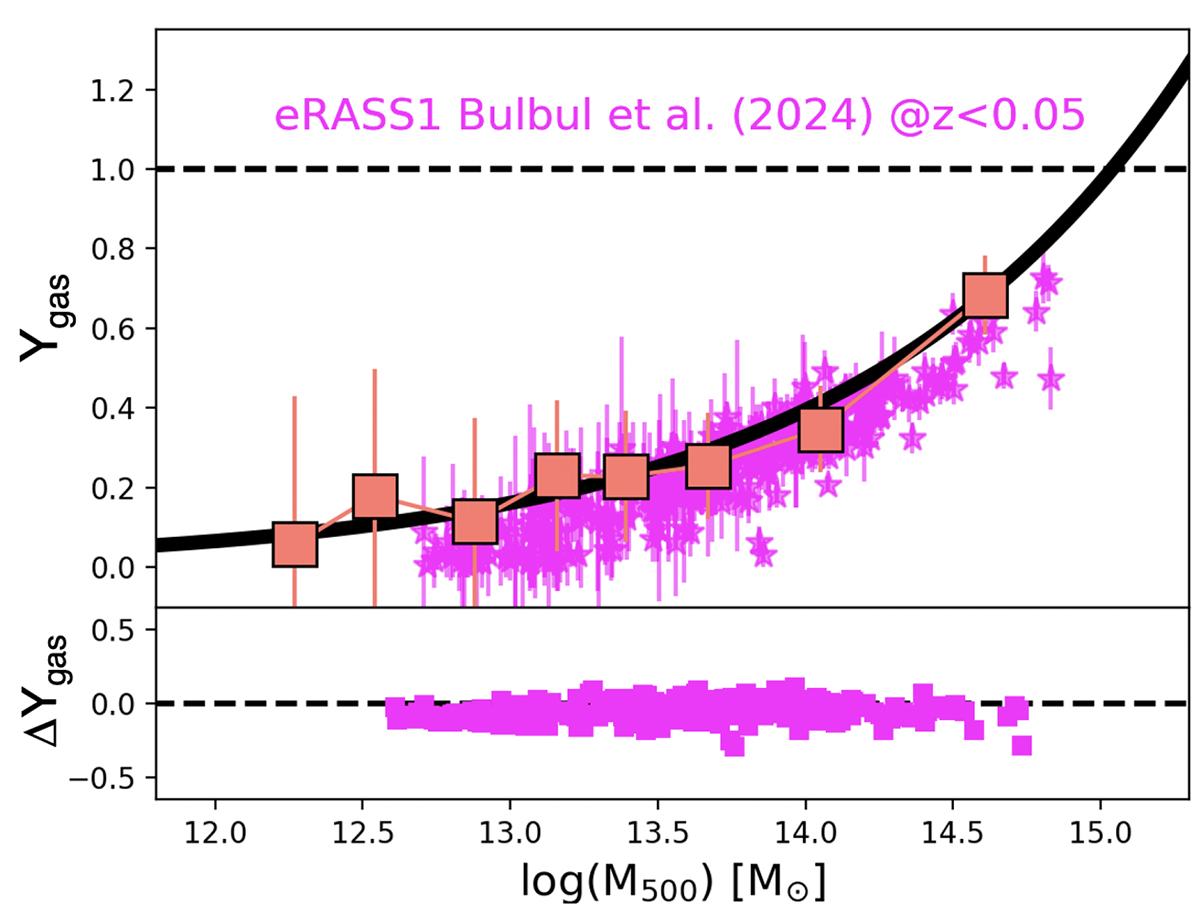
Upper panel: Comparison of the observed Ygas versus mass relations within R500 with the fgas values within the same radius as given by Bulbul et al. (2024) for the eRASS:1 extended objects at z < 0.05 and with an optical counterpart. Lower panel: Residuals of the eRASS:1 data from the best fit of Fig. 4 expressed in dex (log(fgas)−log(fit)).
Current usage metrics show cumulative count of Article Views (full-text article views including HTML views, PDF and ePub downloads, according to the available data) and Abstracts Views on Vision4Press platform.
Data correspond to usage on the plateform after 2015. The current usage metrics is available 48-96 hours after online publication and is updated daily on week days.
Initial download of the metrics may take a while.