Fig. 1
Download original image
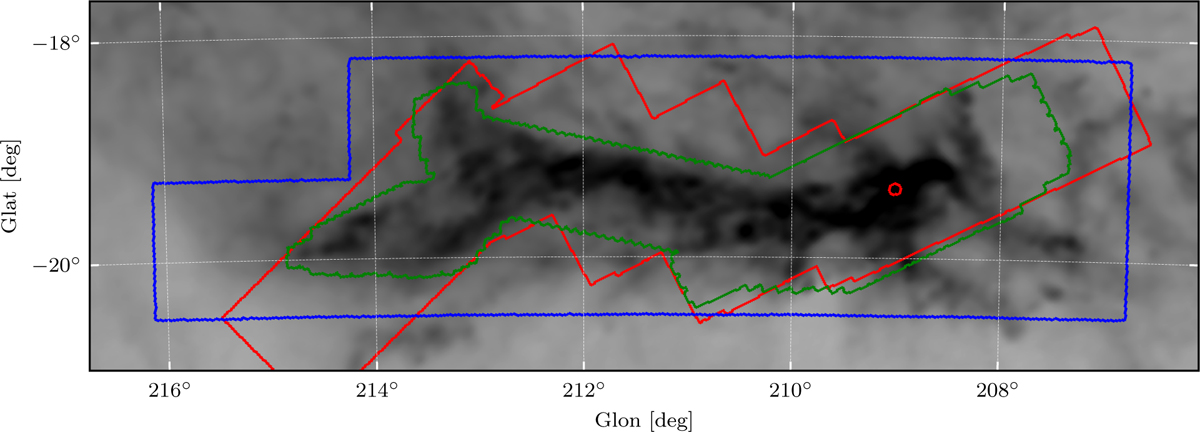
Survey footprints of the image data. The blue outlines show the area covered by the J, H, and Ks filters, the green box shows the area covered by the four IRAC filters, and the red lines highlight the area observed in the MIPS 1 filter. The background image shows the dust emission from the Planck satellite at 545 GHz (Planck Collaboration 2020).
Current usage metrics show cumulative count of Article Views (full-text article views including HTML views, PDF and ePub downloads, according to the available data) and Abstracts Views on Vision4Press platform.
Data correspond to usage on the plateform after 2015. The current usage metrics is available 48-96 hours after online publication and is updated daily on week days.
Initial download of the metrics may take a while.