Open Access
Fig. 3
Download original image
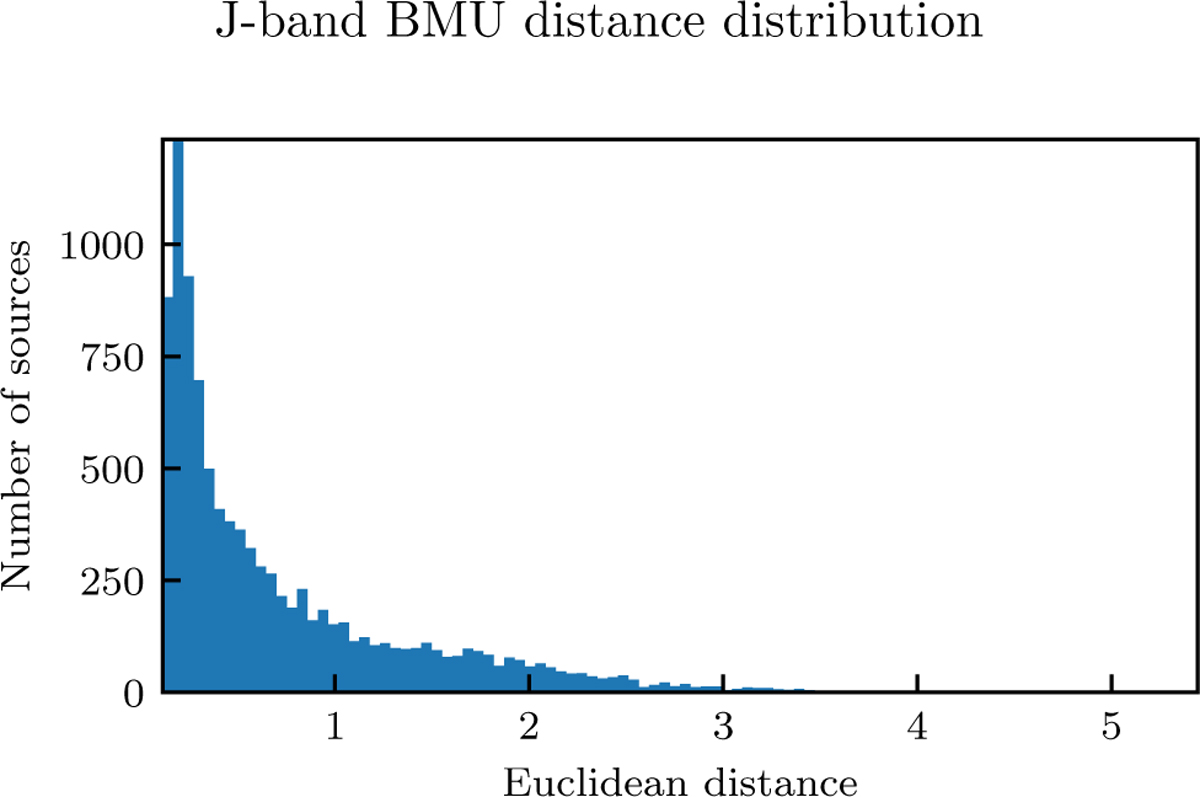
J-band distribution of BMU distance of each image in the training sample. The successfully trained SOM features a distribution of BMU distances with a peak at very small distances and a tail of large distances representing outliers.
Current usage metrics show cumulative count of Article Views (full-text article views including HTML views, PDF and ePub downloads, according to the available data) and Abstracts Views on Vision4Press platform.
Data correspond to usage on the plateform after 2015. The current usage metrics is available 48-96 hours after online publication and is updated daily on week days.
Initial download of the metrics may take a while.