Open Access
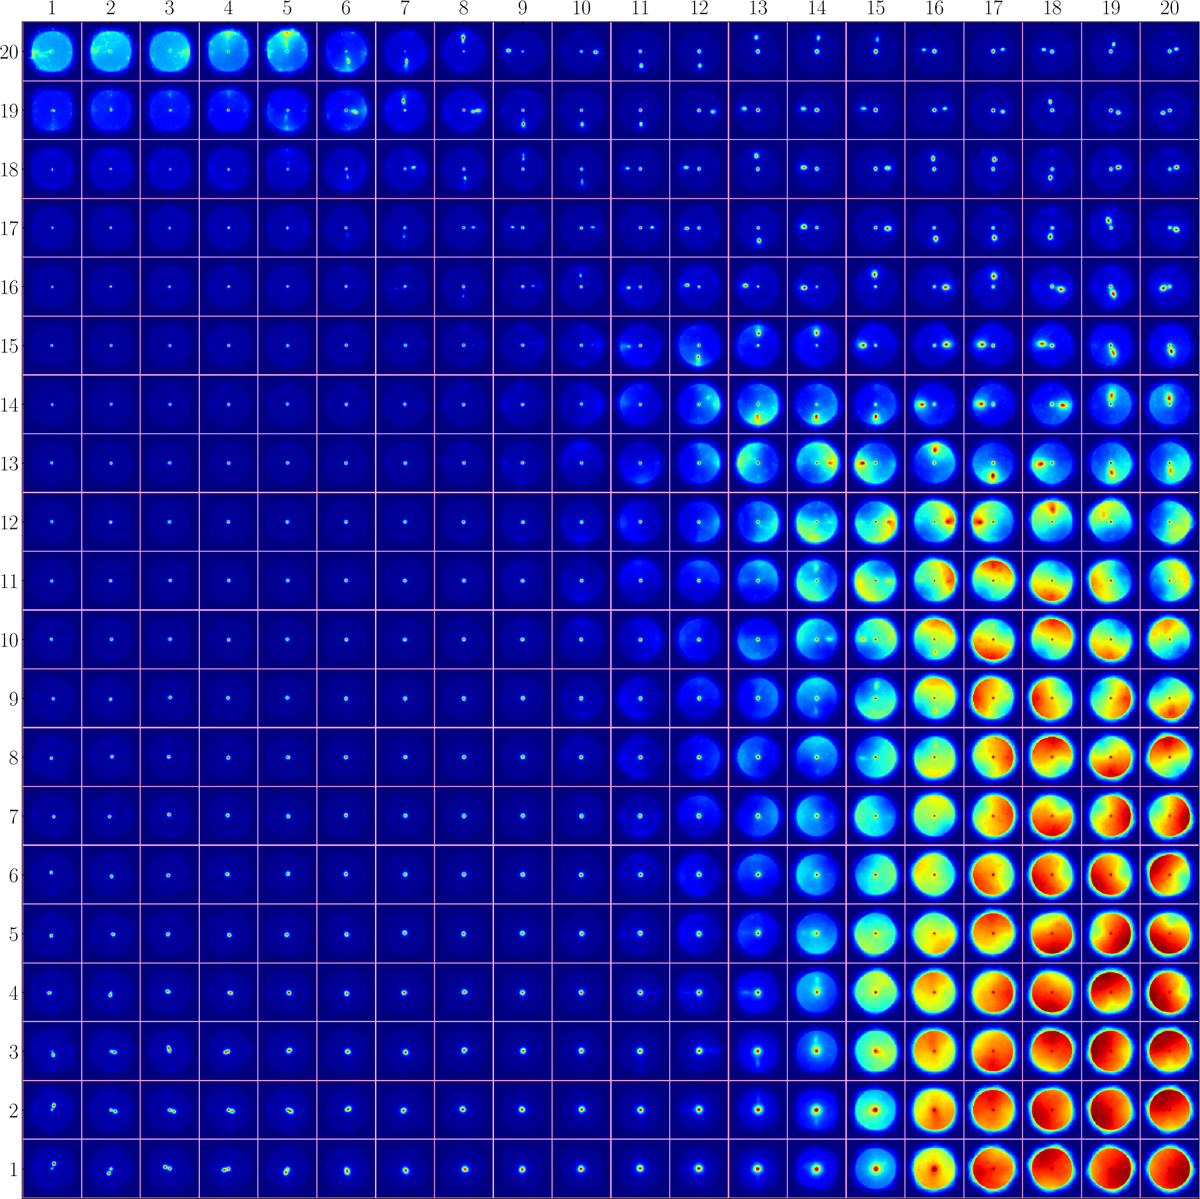
Fig. 4
Download original image
J-band SOM prototypes. The numbers at the left and top edges indicate the coordinates in the latent space created by the self-organizing map algorithm, i.e., the coordinates of the neurons representing each prototype.
Current usage metrics show cumulative count of Article Views (full-text article views including HTML views, PDF and ePub downloads, according to the available data) and Abstracts Views on Vision4Press platform.
Data correspond to usage on the plateform after 2015. The current usage metrics is available 48-96 hours after online publication and is updated daily on week days.
Initial download of the metrics may take a while.