Fig. 5
Download original image
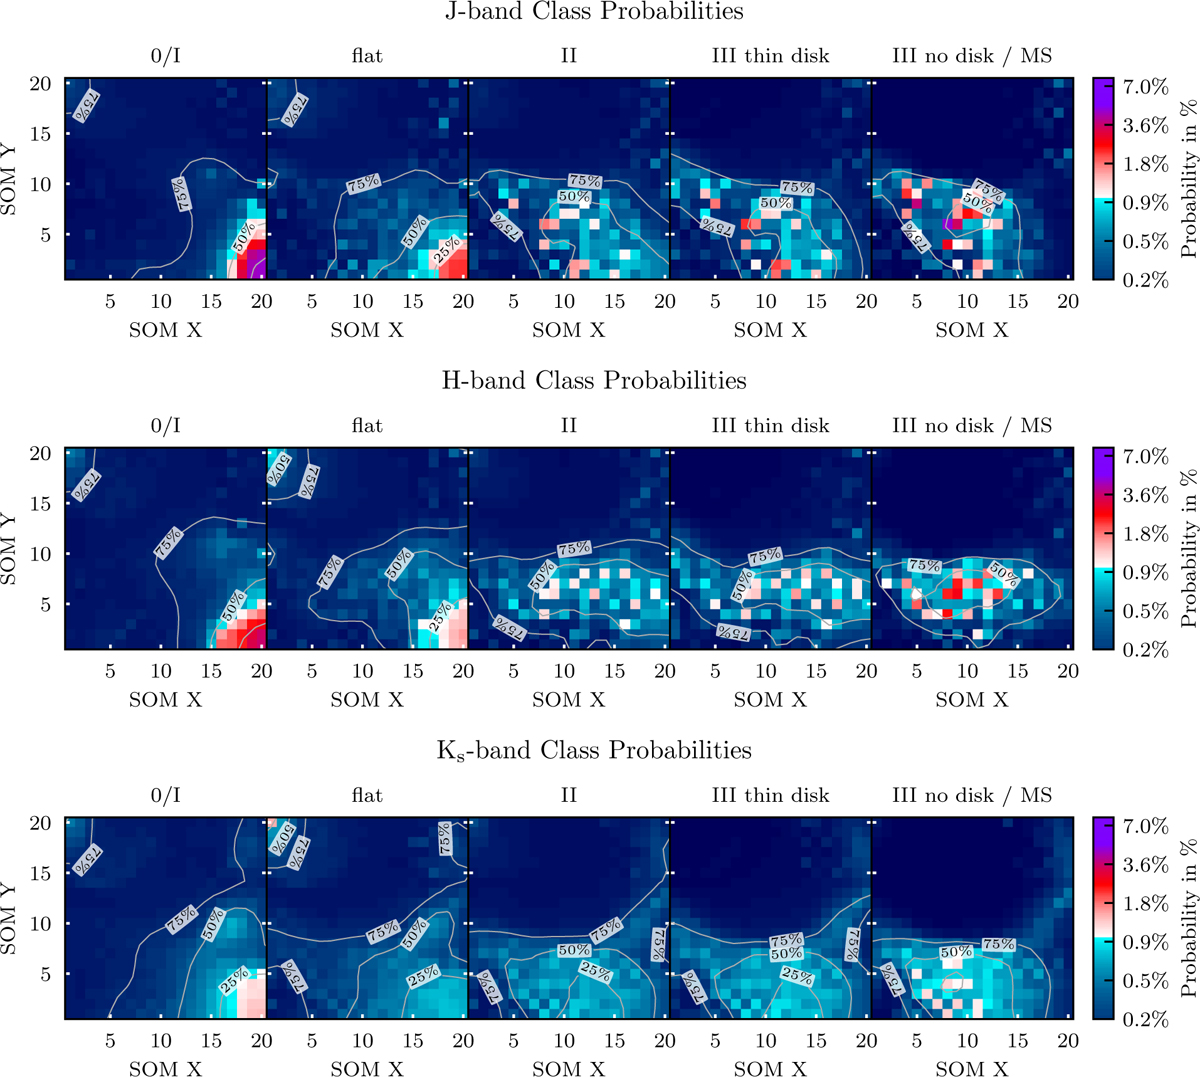
Probability density function for each observational class in the J, H, and Ks band. These maps highlight the regions on the SOM in which the probability of finding a specific class of YSO is highest. The five panels from left to right show the probabilities per neuron for each class, starting with the youngest on the left and ending with the oldest, most evolved class to the right. The contours in each panel enclose the area within which 25%, 50%, and 75% of all YSOs of a given class are located within the map.
Current usage metrics show cumulative count of Article Views (full-text article views including HTML views, PDF and ePub downloads, according to the available data) and Abstracts Views on Vision4Press platform.
Data correspond to usage on the plateform after 2015. The current usage metrics is available 48-96 hours after online publication and is updated daily on week days.
Initial download of the metrics may take a while.