Fig. A.1
Download original image
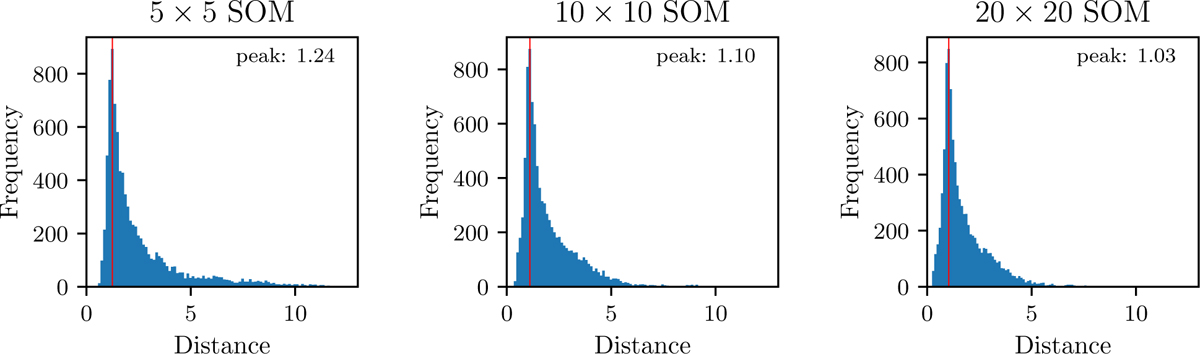
BMU distance histograms for SOM sizes of 5 × 5, 10 × 10, and 20 × 20 neurons. These histograms show the distribution of Euclidean distances between a YSO image and its corresponding best-matching unit for all source images in the training sample. From left to right, the panels show the distribution of BMU distances for increasing SOM sizes. The red vertical line indicates the position of the peak of the distance distribution.
Current usage metrics show cumulative count of Article Views (full-text article views including HTML views, PDF and ePub downloads, according to the available data) and Abstracts Views on Vision4Press platform.
Data correspond to usage on the plateform after 2015. The current usage metrics is available 48-96 hours after online publication and is updated daily on week days.
Initial download of the metrics may take a while.